A
B
C
D
लिखित उत्तर
Verified by Experts
The correct Answer is:


Recommended Questions
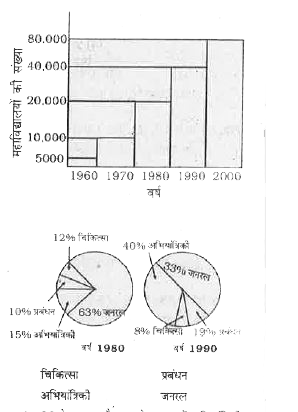
- नीचे दिए गए ग्राफ में विभिन्न वर्षो में भारत में विभिन्न महाविधालयों क...
Text Solution
|
- यह ज्ञात है की महाविद्यालय के छात्रों में से 60 % छात्रावास में रहते ...
Text Solution
|
- Study the following pie chart and table to answer the question.Total n...
Text Solution
|
- The following line diagram represents the yearly sales figure of a com...
Text Solution
|
- पत्रकारिता के विभिन्न आयामों में से एक है
Text Solution
|
- पत्रकारिता के विभिन्न आयामों में से एक है
Text Solution
|
- The given bar graph shows the number of marks scored by a student in e...
Text Solution
|
- The given bar graph shows the number of marks scored by a student in e...
Text Solution
|
- The given Bar Graph presents the number of students of two schools for...
Text Solution
|