A
B
C
D
लिखित उत्तर
Verified by Experts
The correct Answer is:


Recommended Questions
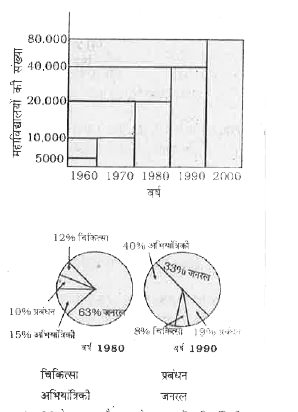
- नीचे दिए गए ग्राफ में विभिन्न वर्षो में भारत में विभिन्न महाविधालयों क...
Text Solution
|
- चित्र में दिया गया वृत्त चार्ट मई -जून 2013 के दौरान वाहनों का केन्...
Text Solution
|
- चित्र में दिया गया वृत्त चार्ट मई -जून 2013 के दौरान वाहनों का केन्...
Text Solution
|
- Study the following pie chart and table to answer the question.Total n...
Text Solution
|
- Study the following pie chart and table to answer the question.Total n...
Text Solution
|
- The given table shows the number (in percent) of employees working in ...
Text Solution
|
- The given bar graph shows the number of marks scored by a student in e...
Text Solution
|
- The bar graph given below shows the wheat production (in tonnes) of a ...
Text Solution
|
- The number of students in class XI in science, arts and commerce strea...
Text Solution
|