A
B
C
D
Text Solution
Verified by Experts
The correct Answer is:


Topper's Solved these Questions
Similar Questions
Explore conceptually related problems
MAHENDRA-TEST - 4-MULTIPLE CHOICE QUESTIONS
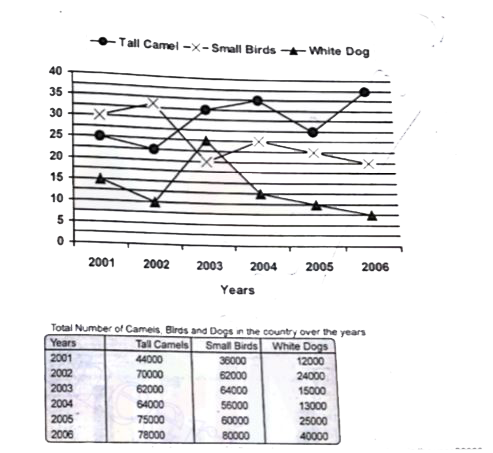
- Study the following graph and table carefully and answer the question ...
Text Solution
|
- Study the following graph and table carefully and answer the question ...
Text Solution
|
- Study the following graph and table carefully and answer the question ...
Text Solution
|
- Study the following graph and table carefully and answer the question ...
Text Solution
|
- What is the percentage of marks obtained by R in all the six subjects?
Text Solution
|
- Study the following information carefully and answer the questions giv...
Text Solution
|
- Study the following information carefully and answer the questions giv...
Text Solution
|
- Study the following information carefully and answer the questions giv...
Text Solution
|
- Study the following information carefully and answer the questions giv...
Text Solution
|
- Study the following graph carefully and answer the questions given bel...
Text Solution
|
- Study the following graph carefully and answer the questions given bel...
Text Solution
|
- Study the following graph carefully and answer the questions given bel...
Text Solution
|
- Study the following graph carefully and answer the questions given bel...
Text Solution
|
- Study the following graph carefully and answer the questions given bel...
Text Solution
|
- What approximate value should come in place of the question mark (?) i...
Text Solution
|
- What approximate value should come in place of the question mark (?) i...
Text Solution
|
- What approximate value should come in place of the question mark (?) i...
Text Solution
|
- What approximate value should come in place of the question mark (?) i...
Text Solution
|
- What approximate value should come in place of the question mark (?) i...
Text Solution
|
- Out of the 20,000 candidates are eligible for election post 500 candid...
Text Solution
|