Home
Class 12
PHYSICS
The graph shown in Fig.1.15 represenrts ...

The graph shown in Fig.1.15 represenrts a plot of current versus voltage for a given semiconductor.

identify the region,if any,over which the semiconductor has a negative resistance.

Promotional Banner

Topper's Solved these Questions

  • Solids

    MODERN PUBLICATION|Exercise EXERCISE|66 Videos
  • SEMICONDUCTOR DEVICES

    MODERN PUBLICATION|Exercise EXERCISE|174 Videos
  • STRUCTURE OF NUCLEUS

    MODERN PUBLICATION|Exercise EXERCISE|47 Videos

Similar Questions

Explore conceptually related problems

From the graph between current (I) and voltage (V) as shown in the figure, identify the portion correspoindgin to negative resistance

Two stones are thrown up simultaneously from the edge of a cliff 200 m high with initial speeds of 15 m s^-1 and 30 m s^-1 . Verify that the graph shown in Fig. 3.27 correctly represents the time variation of the relative position of the second stone with respect to the first. Neglect air resistance and assume that the stones do not rebound after hitting the ground. Take g = 10 m s^-2 . Give the equations for the linear and curved parts of the plot.

Determine the current drawn from a 12V supply with internal resistance 0.5 Omega by the infinite network shown in Fig. Each resistor has 1Omega resistance. :

Assume that the silicon diode in the circui shown in fig. requires a minimum current of 1mA to be above the knee point (0.7V) of its I-V characteristics. Aslo assume that the voltage across the diode is independent of current above the knee point. What is the power dissipated in the resistance R and in the diode, when a current of 5mA flows in the circuit at V_(B)=6V ?

The velocity-time graph of a particle in one-dimensional motion is shown in Fig. 3.29 :- Which of the following formulae are correct for describing the motion of the particle over the time-interval:- x(t_2)-x(t_1) area under the v-t curve bounded by the t-axis and the dotted line shown.

Draw a simple circuit of a CE transistor amplifier. Explain its working. Show that the voltage gain, A_V of the amplifier is given by A_v = - ( beta_(ac) R_L )/(r_i) where beta_(Ac) is the current gain, R_L is the load resistance and r_1 is the input resistance of the transistor. What is the significance of the negative sign in the expression for the voltage gain?

A right angle prism (45^@-90^@-45^@) of refractive index mu has a plate of refractive index mu,(mu_1 lower than mu) cemented to its diagonal face.The assembly is in air.A ray is incident at face AB as shown in Fig.3.15 . Calculate the angle of incidence at face AB for which the ray strikes the diagonal face at critical angle.

In a particular experiment, a high voltage is created by charging an isolated metal sphere as shown in the fig. The sphere has diameter 42 cm and any charge on its surface may be considered as if it were concentrated at its center. The air surrounding the sphere loses its insulating properties, causing a spark, when the electric field exceeds 20 kV cm^-1 . Calculate for the charged sphere when a spark is about to occur the charge on the sphere and its potential.

A right angle prism (45^@-90^@-45^@) of refractive index mu has a plate of refractive index mu,(mu_1 lower than mu) cemented to its diagonal face.The assembly is in air.A ray is incident at face AB as shown in Fig.3.15 . Assuming mu=1.352 ,calculate the angle of incidence at face AB for which the refracted ray passes throught the diagonal face undeviated.

MODERN PUBLICATION-Solids-EXERCISE
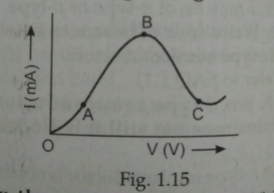
  1. The graph shown in Fig.1.15 represenrts a plot of current versus volta...

    Text Solution

    |

  2. Explain the formation of energy bands in solids and hence define condu...

    Text Solution

    |

  3. Draw the energy band diagram of N-type semiconductor.

    Text Solution

    |

  4. Draw the energy-band diagram of p-type semiconductor.

    Text Solution

    |

  5. Give the enregy band diagram for metls

    Text Solution

    |

  6. Draw the energy band diagram of N-type semiconductor.

    Text Solution

    |

  7. Draw the energy-band diagram of p-type semiconductor.

    Text Solution

    |

  8. Draw the energy-band diagram for an insulator.

    Text Solution

    |

  9. Explain the behaviour of semiconductors and insulators on the basis of...

    Text Solution

    |

  10. Explain various energy bands in an atom.

    Text Solution

    |

  11. On the basis of the energy band diagrams distinguish between metals, i...

    Text Solution

    |

  12. Draw a labelled energy band diagram for an insulator,a conductor and a...

    Text Solution

    |

  13. Draw a labelled energy band diagram for an insulator,a conductor and a...

    Text Solution

    |

  14. Draw the energy-band diagram for an insulator.

    Text Solution

    |

  15. On the basis of the energy band diagrams distinguish between metals, i...

    Text Solution

    |

  16. What are ‘holes’? Write their characteristics.

    Text Solution

    |

  17. What is doping ? Write three necessary conditions for it and two metho...

    Text Solution

    |

  18. What is doping ? Write three necessary conditions for it and two metho...

    Text Solution

    |

  19. What is doping? What are the necessary conditions for it? State any me...

    Text Solution

    |

  20. A n-type semiconductor is:

    Text Solution

    |

  21. What is an intrinsic Semi-conductor ?

    Text Solution

    |