 .
. A
B
C
D
Text Solution
Verified by Experts


Similar Questions
Explore conceptually related problems
Recommended Questions
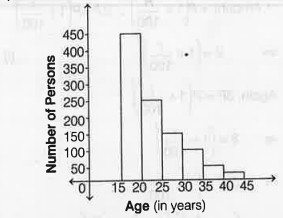
- Direction :- Study the histogram and answer the following questions ...
Text Solution
|
- Which of the following symbols are not acceptable ? (i) .(35)^(79)Br (...
Text Solution
|
- Symbols .(35)^(79) Br and ^(79)Br can be written whereas symbols (79...
Text Solution
|
- The value of |[a,a+d,a+2d] , [a+d,a+2d,a+3d] , [a+2d,a+3d,a+4d]|+|[b,b...
Text Solution
|
- Symbols .(35)^(79)Br and .^(79)Br can be written whereas symbols .(79)...
Text Solution
|
- Match the following Column A to Column B
Text Solution
|
- The inequation that best describes the following graph is <img src="h...
Text Solution
|
- In the given figure, PQRS is a parallelogram. A and B are the mid-poin...
Text Solution
|
- ""(35)^(79)Br तथा ""^(79)Br प्रतीक मान्य है, जबकि ""(79)^(35)Br तथा "...
Text Solution
|