A
B
C
D
Text Solution
Verified by Experts


Similar Questions
Explore conceptually related problems
Recommended Questions
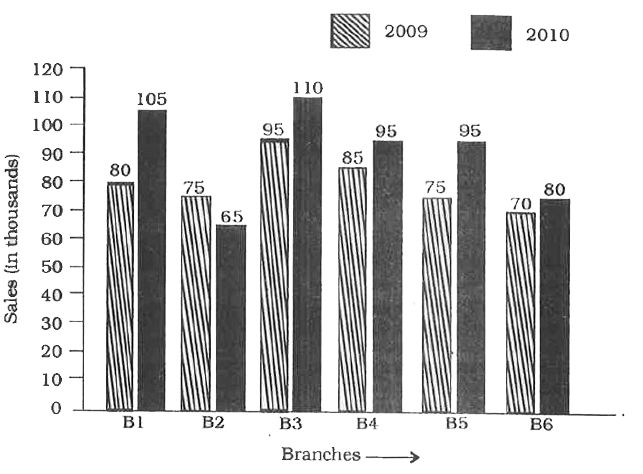
- In the following bar diagram sales of books (in thousand numbers) from...
Text Solution
|
- Table shows the sales of books from six branches of a publishing compa...
Text Solution
|
- The given Bar Graph present the sales of the number of books (in thous...
Text Solution
|
- The given bar chart shows the sales of books from six branches of a pu...
Text Solution
|
- The table shows the number of books (in thousand) sold in the years 20...
Text Solution
|
- Find the ratio of the sales made by branches B1, B3 and B5 for both th...
Text Solution
|
- In the given bar graph, the sales of books are shown for six brachos, ...
Text Solution
|
- Sales of books (in thousands) from six branches (B1, B2, B3, B4, B5, B...
Text Solution
|
- Sales of books (in thousands) from six branches (B1, B2, B3, B4, B5, B...
Text Solution
|