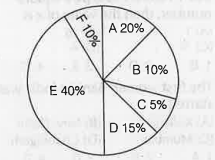
 Which partner has the lowest share? (A)C (B) B (C) D (D) F


Similar Questions
Explore conceptually related problems
Recommended Questions
- Direction The pie chart shows the shares of 6 partners in certain comp...
Text Solution
|
- In the given figure (not to scale), O is the centre of the circle. A,B...
Text Solution
|
- Which of the following are correct chain isomers of butane ? (i) <img ...
Text Solution
|
- Determine the point of symmetry of a regular hexagon. <img src="htt...
Text Solution
|
- Dtermine the images of the following figure about the given line : ...
Text Solution
|
- Match the following Column A to Column B
Text Solution
|
- Match the following Column A to Column B
Text Solution
|
- Match the following Column A to Column B
Text Solution
|
- The inequation represented by the graph given below is : <img src="htt...
Text Solution
|