A
B
C
D
Text Solution
Verified by Experts


Similar Questions
Explore conceptually related problems
Recommended Questions
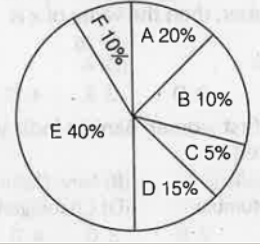
- The pie chart shows the shares of 6 partners in certain company. Study...
Text Solution
|
- The value of |[a,a+d,a+2d] , [a+d,a+2d,a+3d] , [a+2d,a+3d,a+4d]|+|[b,b...
Text Solution
|
- Match the following Column A to Column B
Text Solution
|
- In the given figure, PQRS is a parallelogram. A and B are the mid-poin...
Text Solution
|
- 1) Fragmentation () a) Planaria br 2) Unripe fruits () b) Yeast br 3) ...
Text Solution
|
- The order of reactivity of halogens is (A) F>Cl>Br>I (B) F < Cl < B...
Text Solution
|
- Can Fe^(3+) oxidize Br^(-) " to "Br2 at 1 M concentration ? E^@(Fe^(...
Text Solution
|
- [" Which alkyl bromide will yield only one alkene upon "E(2)" eleminat...
Text Solution
|
- Find correct features w.r.t. most advanced type of placentation. Br a....
Text Solution
|