A
B
C
D
Text Solution
Verified by Experts


Similar Questions
Explore conceptually related problems
Recommended Questions
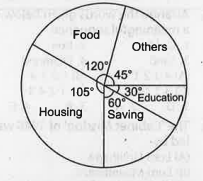
- Direction: The pie-chart given hereshows expenditures incurred by a fa...
Text Solution
|
- Match the following Column A to Column B
Text Solution
|
- The inequation represented by the graph given below is : <img src="htt...
Text Solution
|
- Directions : The pie-chart given below shows expenditure incurred by a...
Text Solution
|
- Directions : The pie-chart given below shows expenditure incurred by a...
Text Solution
|
- 'A' is the portion of adenophypophysis which secrets different hormone...
Text Solution
|
- Identify A,B,C and D,E <img src="https://d10lpgp6xz60nq.cloudfront.net...
Text Solution
|
- The pie-chart given here shows expenditures incurred by a family on va...
Text Solution
|
- Directions : The pie-chart given below shows expenditure incurred by a...
Text Solution
|