A
B
C
D
Text Solution
Verified by Experts


Similar Questions
Explore conceptually related problems
Recommended Questions
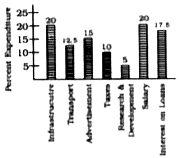
- The bar graph shows the percentage distribution of the total expenditu...
Text Solution
|
- Match the following Column A to Column B
Text Solution
|
- The inequation represented by the graph given below is : <img src="htt...
Text Solution
|
- The inequation that best describes the graph given below is <img src=...
Text Solution
|
- The inequation that best describes the following graph is <img src="h...
Text Solution
|
- The bar diagram shows the monthly expenditure of a company. Study the ...
Text Solution
|
- Study the following graph and answer the question. Percentage distribu...
Text Solution
|
- The bar-graph given below shows the percentage distribution of total e...
Text Solution
|
- The bar-graph given below shows the percentage distribution of total e...
Text Solution
|