A
B
C
D
Text Solution
Verified by Experts


Similar Questions
Explore conceptually related problems
Recommended Questions
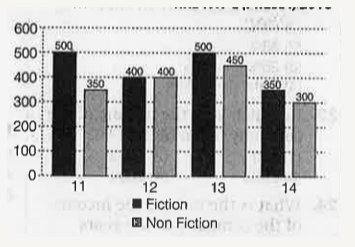
- The bar chart represents number of fiction and non-fiction books in fo...
Text Solution
|
- Determine the point of symmetry of a regular hexagon. <img src="htt...
Text Solution
|
- Match the following Column A to Column B
Text Solution
|
- Match the following Column A to Column B
Text Solution
|
- Match the following Column A to Column B
Text Solution
|
- The inequation represented by the graph given below is : <img src="htt...
Text Solution
|
- The inequation that best describes the graph given below is <img src=...
Text Solution
|
- The inequation that best describes the following graph is <img src="h...
Text Solution
|
- Three energy levels L1,L2 and L3 of a hydrogen atom correspond to incr...
Text Solution
|