A
B
C
D
Text Solution
Verified by Experts


Similar Questions
Explore conceptually related problems
Recommended Questions
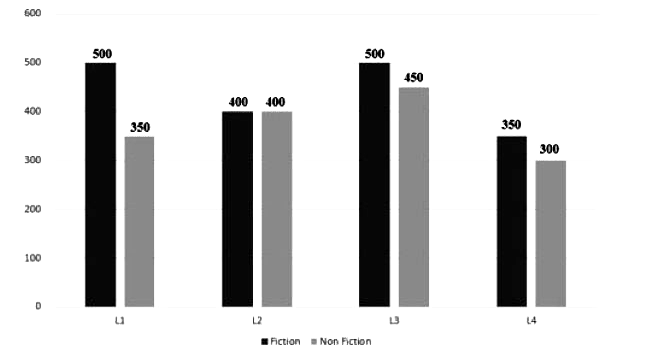
- The bar chart represents number of fiction and non -fiction books in f...
Text Solution
|
- The value of |[a,a+d,a+2d] , [a+d,a+2d,a+3d] , [a+2d,a+3d,a+4d]|+|[b,b...
Text Solution
|
- Match the following Column A to Column B
Text Solution
|
- The inequation represented by the graph given below is : <img src="htt...
Text Solution
|
- In the given figure, PQRS is a parallelogram. A and B are the mid-poin...
Text Solution
|
- Select the features of Rhizopus. Br (a) Saprophytic fungus, br (b) Hyp...
Text Solution
|
- Wite down the corresponding elements in the figure : 1)……………… br 2)………...
Text Solution
|
- Consider the following modified structures in plants and select ontoge...
Text Solution
|
- C(6)H(13)Br+OH^(-)rarrC(6)H(13)OH+Br^(-) Br is an example of:
Text Solution
|