A
B
C
D
Text Solution
Verified by Experts


Similar Questions
Explore conceptually related problems
Recommended Questions
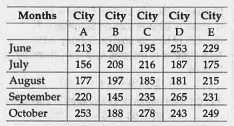
- The table below depicts the Number of books Sold by 5 cities during 5 ...
Text Solution
|
- Read the bar graph (Fig 3.4) and answer the questions that follow:Num...
Text Solution
|
- How many books were sold in 1989 ?
Text Solution
|
- Read the bar graph (Fig 3.4) and answer the questions that follow:Num...
Text Solution
|
- how many books were sold in 1989?
Text Solution
|
- Read the bar graph which shows the number of books sold by a bookstore...
Text Solution
|
- Read the bar graph given below which shows the number of books sold by...
Text Solution
|
- Read the bar graph given below which shows the number of books sold by...
Text Solution
|
- Read the bar graph given below which shows the number of books sold by...
Text Solution
|