A
B
C
D
Text Solution
Verified by Experts


Similar Questions
Explore conceptually related problems
Recommended Questions
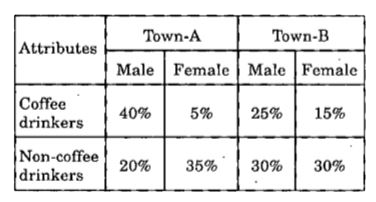
- The following table shows the percentage of male and female coffee dri...
Text Solution
|
- in a town the population in was 8ooo in one year, male population incr...
Text Solution
|
- 55% of the population of a town are males. If the total population ...
Text Solution
|
- In an area of the total people 40% were women and 45% coffee drinkers....
Text Solution
|
- In a sample study about the coffee habits in two towns, following data...
Text Solution
|
- Match the following Column A to Column B
Text Solution
|
- The inequation that best describes the following graph is <img src="h...
Text Solution
|
- In a town,the population was 8000.In one year,male population increase...
Text Solution
|
- UP BOARD|Gandhiji and a coffee Drinker #!#Detail Explanation Part-1
Text Solution
|