A
B
C
D
Text Solution
Verified by Experts
The correct Answer is:


Topper's Solved these Questions
Similar Questions
Explore conceptually related problems
MAHENDRA-TEST-1 (QUANTITATIVE APTITUDE-QUESTION
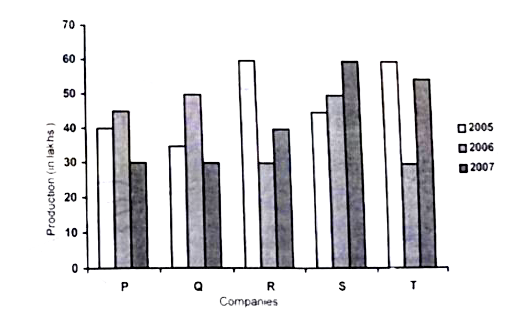
- Read the following graph carfully and answer the questions given below...
Text Solution
|
- Read the following graph carfully and answer the questions given below...
Text Solution
|
- Read the following graph carfully and answer the questions given below...
Text Solution
|
- The sum of a two-digit number and the number obtained by interchanging...
Text Solution
|
- 2500 students appeared in an examination in which (1)/(5) of the total...
Text Solution
|
- The area of a rectangular fieldis 15 times the sum of its length and b...
Text Solution
|
- Anshul purchased a chair at three-fourth of its cost price and sold it...
Text Solution
|
- Manish is 15 years elder to Nikunj and after 5 years, the Nikunj's age...
Text Solution
|
- If 25% of two-third of a number is 10, what is the number?
Text Solution
|
- What value will come in place of question mark (?) in the following qu...
Text Solution
|
- Which of the following set
Text Solution
|
- The circumference of a circle is 132 m. What is the area of the circle...
Text Solution
|
- The population of a city at present is 80000. If it increase by 5% per...
Text Solution
|
- What value will come in place of question mark (?) in number-series gi...
Text Solution
|
- What value will come in place of question mark (?) in number-series gi...
Text Solution
|
- What value will come in place of question mark (?) in number-series gi...
Text Solution
|
- What value will come in place of question mark (?) in number-series gi...
Text Solution
|
- What value will come in place of question mark (?) in number-series gi...
Text Solution
|
- Read the following table carefully and answer the question given below...
Text Solution
|
- Read the following table carefully and answer the question given below...
Text Solution
|