A
B
C
D
Text Solution
Verified by Experts
The correct Answer is:


Topper's Solved these Questions
Similar Questions
Explore conceptually related problems
MAHENDRA-TEST-1 (QUANTITATIVE APTITUDE-QUESTION
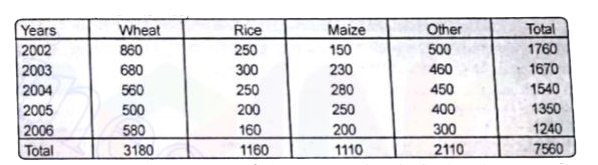
- Read the following table carefully and answer the question given below...
Text Solution
|
- Read the following table carefully and answer the question given below...
Text Solution
|
- Read the following table carefully and answer the question given below...
Text Solution
|
- Read the following table carefully and answer the question given below...
Text Solution
|
- Read the following table carefully and answer the question given below...
Text Solution
|
- Read the following graph carefully and answer the questions given belo...
Text Solution
|
- Read the following graph carefully and answer the questions given belo...
Text Solution
|
- Read the following graph carefully and answer the questions given belo...
Text Solution
|
- Read the following graph carefully and answer the questions given belo...
Text Solution
|
- In each of the following questions, two equations are given. You have ...
Text Solution
|
- In each of the following questions, two equations are given. You have ...
Text Solution
|
- In each of the following questions, two equations are given. You have ...
Text Solution
|
- In each of the following questions, two equations are given. You have ...
Text Solution
|
- In each of the following questions, two equations are given. You have ...
Text Solution
|
- Read the following information carefully and answer the questions give...
Text Solution
|
- Read the following information carefully and answer the questions give...
Text Solution
|
- Read the following information carefully and answer the questions give...
Text Solution
|
- Read the following information carefully and answer the questions give...
Text Solution
|
- Read the following information carefully and answer the questions give...
Text Solution
|
- What is the total number of students in a college ? I. 75% of the to...
Text Solution
|