A
B
C
D
Text Solution
Verified by Experts
The correct Answer is:


Topper's Solved these Questions
Similar Questions
Explore conceptually related problems
UPKAR PUBLICATION -PRACTICE SET 1-PART-III QUANTITATIVE APTITUDE
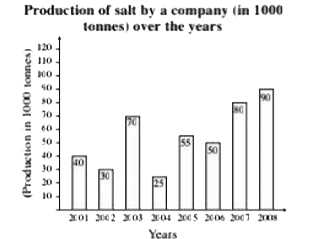
- Study the following graph and answer questions In how many of...
Text Solution
|
- Study the following graph and answer questions The average prod...
Text Solution
|
- Study the following graph and answer questions What was the p...
Text Solution
|
- Study the following graph and answer questions What was the p...
Text Solution
|
- Study the pie charts given below carefully and answer each of the ques...
Text Solution
|
- Study the pie charts given below carefully and answer each of the ques...
Text Solution
|
- Study the pie charts given below carefully and answer each of the ques...
Text Solution
|
- Study the pie charts given below carefully and answer each of the ques...
Text Solution
|
- Study the following table carefully and answer each of the questions. ...
Text Solution
|
- Study the following table carefully and answer each of the questions. ...
Text Solution
|
- The value of (sqrt(4^(3) + 15^(2)))^(3) is :
Text Solution
|
- By selling 4 articles for 1 rupee, a man loses 4%. Had he sold three a...
Text Solution
|
- If 5.5 of a = 0.65 of b, then a : b is equal to
Text Solution
|
- An article is sold at a loss of 10%. Had it been sold for Rs.90 more, ...
Text Solution
|
- A contractor undertook to finish a work in 92 days and employed 110 me...
Text Solution
|
- From a class of 42 boys, a boy aged 10 years goes away and in his plac...
Text Solution
|
- What is to be added to 15% of 160 so that the sum may be equal to 25% ...
Text Solution
|
- Two trains start from station A and B and travel towards each other at...
Text Solution
|
- The bar diagram below shows the production of potatoes (in quintals) f...
Text Solution
|
- The bar diagram below shows the production of potatoes (in quintals) f...
Text Solution
|