A
B
C
D
Text Solution
Verified by Experts
The correct Answer is:


Topper's Solved these Questions
Similar Questions
Explore conceptually related problems
UPKAR PUBLICATION -PRACTICE SET-5-PART-III (QUANTITIVE QPTITUDE)
- If two triangles are on the same base and between the same parallels. ...
Text Solution
|
- If the angle ACB = 40^(@), angle DPB = 120 ^(@), then find y.
Text Solution
|
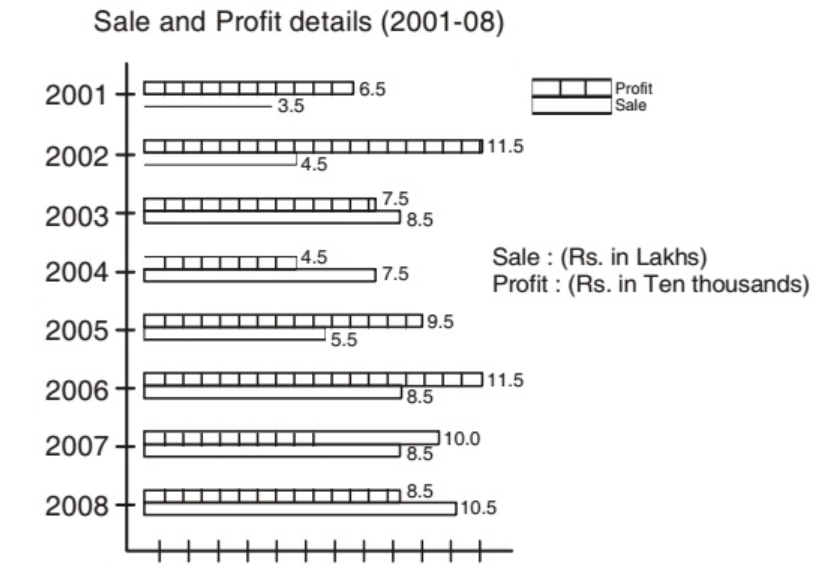
- The bar graph as shown below gives information about the sale and prof...
Text Solution
|
- The bar graph as shown below gives information about the sale and prof...
Text Solution
|
- The bar graph as shown below gives information about the sale and prof...
Text Solution
|
- The bar graph as shown below gives information about the sale and prof...
Text Solution
|
- The bar graph as shown below gives information about the sale and prof...
Text Solution
|
- The pie chart,drawn, shows the spending of a country on various sports...
Text Solution
|
- The pie chart,drawn, shows the spending of a country on various sports...
Text Solution
|
- The pie chart,drawn, shows the spending of a country on various sports...
Text Solution
|
- The pie chart drawn below shows the spendings of a country on various ...
Text Solution
|
- The pie chart,drawn, shows the spending of a country on various sports...
Text Solution
|
- If 3 men and 4 women can build a wall in 43 days , in how many days ca...
Text Solution
|
- A man purchases an item at 4/5th of its selling price and sold it at 1...
Text Solution
|
- An insect flies from the corner A to corner B of a cubic room in 4 sec...
Text Solution
|
- A referigerator and a camera were sold for Rs. 12,000 each. The referi...
Text Solution
|
- A sum of money invested at compound Interest amounts to Rs. 800 in 3 y...
Text Solution
|
- Find the area of a triangle whose base is 25 cm long and corresponding...
Text Solution
|
- The base of an isosceles triangle measures 24 cm and its area is ...
Text Solution
|
- A watch was sold at a profit of 15%. If its cost had been 5% less and ...
Text Solution
|