A
B

C

D
Text Solution
Verified by Experts


Similar Questions
Explore conceptually related problems
Recommended Questions
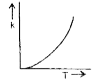
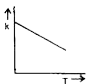
- Plots showing the variation of rate constant (k) with temperature (T) ...
Text Solution
|
- According to the Arrhenius equation a straight line is to be obtained ...
Text Solution
|
- Assertion (A) : k=Ae^(-E(a)//RT) , the Arrhenius equation represents t...
Text Solution
|
- Plots showing the variation of the rate constant (k) with temperature ...
Text Solution
|
- Plots showing the variation of the rate constant (k) with temperature ...
Text Solution
|
- वेग स्थिरांक (rate constant) (K) तथा ताप (T) में खींचे गए ग्राफ नीचे...
Text Solution
|
- Plots showing the variation of the rate constant (k) with temperature ...
Text Solution
|
- Plots showing the variation of the rate constant (k) with temperature ...
Text Solution
|
- According to the Arrhenius equation a straight line is to be obtained ...
Text Solution
|