Home
Class 12
PHYSICS
The graph of Fig. shows the variation of...

The graph of Fig. shows the variation of photoelectric current (I) versus applied voltage (V) for the two different photosensitive materials for two different intensities of the incident radiation. Identify the pairs of curves that correspond to different materials but same intensity of incident radiation.
.

Promotional Banner

Topper's Solved these Questions

  • Particle Nature of Radiation

    MODERN PUBLICATION|Exercise EXERCISE|94 Videos
  • Optical Instruments

    MODERN PUBLICATION|Exercise EXERCISE|100 Videos
  • Polarisation of Light

    MODERN PUBLICATION|Exercise EXERCISE|50 Videos

Similar Questions

Explore conceptually related problems

Draw a plot showing the variation of photoelectric current versus the intensity of incident radiation on a given photosensitive surface.

How will the photoelectric current change on decreasing the wavelength of incident radiation for a given photosensitive material?

For a given photosensitive material, how does photoelectric current change on decreasing the wavelength of incident radiation?

Explain the effect of increase of intensity of incident radiation on photoelectric current with suitable graphs.

Plot a graph showing the variation of stopping potential with the frequency of incident radiation for two different photosensitive materials having work functions W_1 and W_2 (W_1>W_2). On what factors does the slope and intercept of the lines depends.

The figure VSAQ 29 shows a plot of three curves a,b,c, showing the variation of photocurrent in collector plate potential for three different intensities I_1 , I_2 and I_3 having frequencies v_1 , v_2 and v_3 respectively incident on a photosensitive surface. Point out the two curves for which the incident raidations have the same frequency but different intensities.

Write Einstein's photoelectrical equation in terms of the stopping potential and the threshold frequency for a given photosensitive material. Draw a plot showing the variation of stopping potential vs the frequency of incident radiation.

Sketch a graphs showing the variation of stopping potential with frequency of incident radiations for two photosensitive materials A and B having threshold frequencies v_0>v_0' respectively? What information do you get from the slope of the graphs?

In an experiment on photoelectric effect, the following graphs were obtained between the photoelectric current 'I' and anode potential V. Name the characterstics of this incident radiation that was kept constant in this experiment.

The current I and voltage V curves for a given metallic wire at two different temperatures T_1 and T_2 are shown in the figure. Then ,

MODERN PUBLICATION-Particle Nature of Radiation-EXERCISE
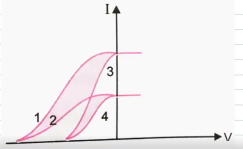
  1. The graph of Fig. shows the variation of photoelectric current (I) ver...

    Text Solution

    |

  2. What is photoelectric effect? State it laws?

    Text Solution

    |

  3. What is photoelectric effect? State it laws?

    Text Solution

    |

  4. State the four laws of photoelectric emission.

    Text Solution

    |

  5. Explain the effect of increase of intensity of incident radiation on p...

    Text Solution

    |

  6. With refrernece to the photoelectric effect,define the terms 'work fun...

    Text Solution

    |

  7. With refrernece to the photoelectric effect,define the terms 'work fun...

    Text Solution

    |

  8. What is phtotelecric effect?Explain the effect of increase of frequen...

    Text Solution

    |

  9. What is phtotelecric effect?Explain the effect of increase of intensi...

    Text Solution

    |

  10. Explain 'stopping potential' and 'threshold frequency' in photoelectri...

    Text Solution

    |

  11. Plot a graph showing the variation of photoelectric current with anode...

    Text Solution

    |

  12. Does the stopping potential in photoelectric emissiondepend upon the i...

    Text Solution

    |

  13. Does the stopping potential in photoelectric emissiondepend upon the f...

    Text Solution

    |

  14. In a plot of photoelectric current versus anode potential how does The...

    Text Solution

    |

  15. In a plot of photoelectric current versus anode potential how does the...

    Text Solution

    |

  16. In a plot of photoelectric current versus anode potential how does pho...

    Text Solution

    |

  17. Define the term threshold frequency and stopping potential in relation...

    Text Solution

    |

  18. Define the term threshold frequency and stopping potential in relation...

    Text Solution

    |

  19. State the dependence of work function on kinetic energy of electrons e...

    Text Solution

    |

  20. Explain 'stopping potential' and 'threshold frequency' in photoelectri...

    Text Solution

    |

  21. Explain briefly, how classical theory could not explain the phenomenon...

    Text Solution

    |