A
B
C
D
Text Solution
Verified by Experts
The correct Answer is:


Recommended Questions
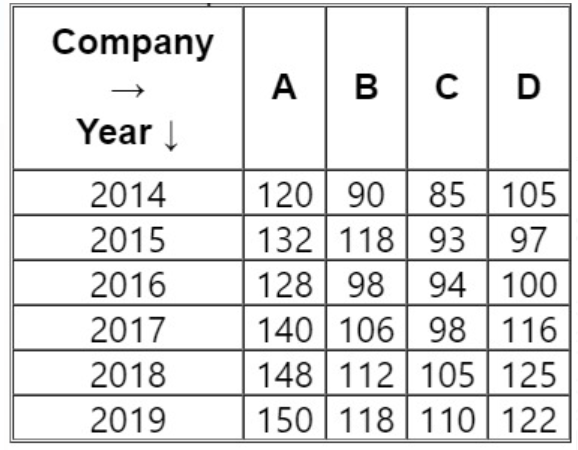
- The given table represents the number of engineers recruited by four c...
Text Solution
|
- The given table represents the number of engineers recruited by four c...
Text Solution
|
- The given table represents the number of engineers recruited by four c...
Text Solution
|
- The given table represents the number of engineers recruited by four c...
Text Solution
|
- The given table represents the number of engineers recruited by four c...
Text Solution
|
- The given table represents the sale (in thousands) of cars by four com...
Text Solution
|
- The given table represents the sale (in thousands) of cars by four com...
Text Solution
|
- The given table represents the sale (in thousands) of cars by four com...
Text Solution
|
- Study the following line chart carefully and answer the questions give...
Text Solution
|