A
B
C
D
Text Solution
Verified by Experts
The correct Answer is:


Similar Questions
Explore conceptually related problems
Recommended Questions
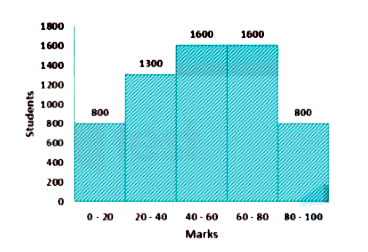
- The histogram shows the number of students and the range of marks scor...
Text Solution
|
- 50 छात्रों की कक्षा में औसतन 70% अंक प्राप्त किए गए । प्रथम 25 छात्रों...
Text Solution
|
- कक्षा IX के 50 छात्रों के अंक विवरन के हिस्ट्रोग्राम का अध्ययन कीजिये ...
Text Solution
|
- दिए गए चित्र में पाँच विद्यालयों में वर्ग 9 की परीक्षा में 80% से अधिक...
Text Solution
|
- गणित के एक टेस्ट में 40 विद्यार्थीयों अंक प्राप्त किए गए । इन अंको ...
Text Solution
|
- In a class test in mathematics, 10 students scored 75 marks, 12 studen...
Text Solution
|
- नीचे दिए गए आयत चित्र में 80 छात्रों के प्राप्तांकों को दर्शाया गया है...
Text Solution
|
- In a class test in English 10 students scored 75 marks, 12 students sc...
Text Solution
|
- कक्षा की गणित परीक्षा में सर्वाधिक अंक पाने वाले विद्यार्थी को सर्वनिम...
Text Solution
|