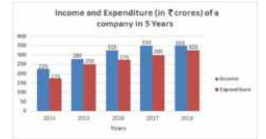
 In which year is the Expenditure more than 40% as compared to the Expenditure in the previous year?
 A
B
C
D
Text Solution
Verified by Experts
The correct Answer is:


Recommended Questions
- The given Bar Graph presents Income and Expenditure (in crores of Rupe...
Text Solution
|
- The inequation represented by the graph given below is : <img src="htt...
Text Solution
|
- The given Bar Graph presents Income and Expenditure (in crores of Rupe...
Text Solution
|
- The given Bar Graph presents Income and Expenditure (in crores of Rupe...
Text Solution
|
- the given bar graph presents income and Expenditure of a company for t...
Text Solution
|
- The given Bar Graph presents Income and Expenditure (in crores of Rupe...
Text Solution
|
- The given bar graph presents the Revenue and Expenditure of a company ...
Text Solution
|
- The given bar graph (bar graph) shows the income and expenditure (in c...
Text Solution
|
- In which year the expenditure is more than 40% as compared to the prev...
Text Solution
|