A
B
C
D
Text Solution
Verified by Experts
The correct Answer is:


Similar Questions
Explore conceptually related problems
Recommended Questions
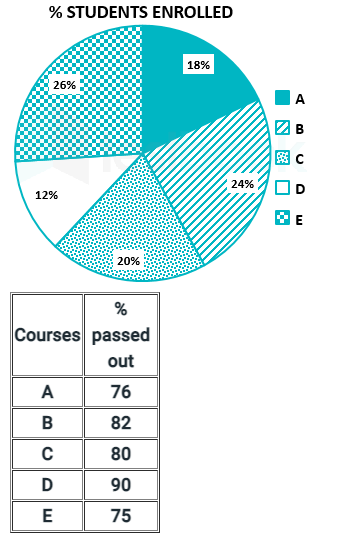
- The given pie chart shows the percentage of students enrolled for the ...
Text Solution
|
- Percentage of students in various courses (A,B,C,D,E,F) and Percentage...
Text Solution
|
- Percentage of students in various courses (A,B,C,D,E,F) and Percentage...
Text Solution
|
- In 2005, from all the colleges together on overall 40 % of the student...
Text Solution
|
- The given pie chart shows the percentage of students enrolled for the ...
Text Solution
|
- In the given bar graph, the number of students enrolled in institute b...
Text Solution
|
- The pie-chart given below shows the number of students enrolled in a s...
Text Solution
|
- दिया गया दंड आरेख (बार ग्राफ ) पाँच वर्ष की अवधि के दौरान संस्थान A और...
Text Solution
|
- The following table shows the number of students enrolled in different...
Text Solution
|