A
B
C
D
Text Solution
Verified by Experts
The correct Answer is:


Similar Questions
Explore conceptually related problems
Recommended Questions
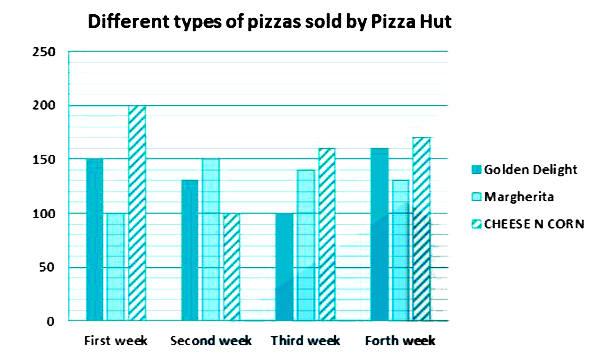
- Study the given bar graph and answer the following questions according...
Text Solution
|
- Match the following Column A to Column B
Text Solution
|
- The inequation represented by the graph given below is : <img src="htt...
Text Solution
|
- The inequation that best describes the graph given below is <img src=...
Text Solution
|
- The inequation that best describes the following graph is <img src="h...
Text Solution
|
- In the given figure, PQRS is a parallelogram. A and B are the mid-poin...
Text Solution
|
- A pizza has a fixed initial cost of $180,000 and a variable cost of $4...
Text Solution
|
- A pizzeria's top-selling pizzas are The Works and The Hawaiian. The Wo...
Text Solution
|
- At a certain pizzeria, (1)/(6) of the pizzas sold in a week were chee...
Text Solution
|