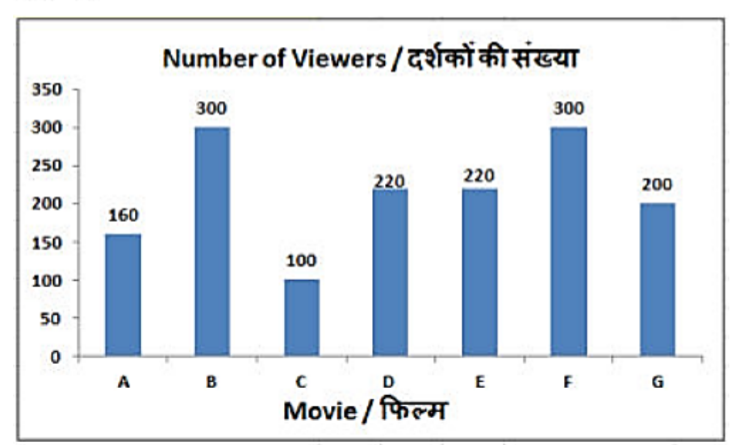
A
B
C
D
Text Solution
Verified by Experts
The correct Answer is:


Similar Questions
Explore conceptually related problems
Recommended Questions
- The bar graph shows results of a survey. 1500 people exiting multiplex...
Text Solution
|
- Determine the point of symmetry of a regular hexagon. <img src="htt...
Text Solution
|
- Match the following Column A to Column B
Text Solution
|
- The inequation represented by the graph given below is : <img src="htt...
Text Solution
|
- The inequation that best describes the graph given below is <img src=...
Text Solution
|
- The inequation that best describes the following graph is <img src="h...
Text Solution
|
- Seven girls P,Q,R,S,T,U and V are watching movies on different days of...
Text Solution
|
- Seven girls P,Q,R,S,T,U and V are watching movies on different days of...
Text Solution
|
- the graph above that summarizes a survey of a group of 250 people who ...
Text Solution
|