A
B
C
D
Text Solution
Verified by Experts
The correct Answer is:


Similar Questions
Explore conceptually related problems
Recommended Questions
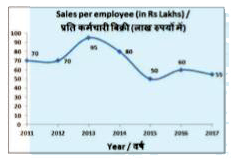
- The line graph shows the Sales per employee of a certain company. Stud...
Text Solution
|
- Match the following Column A to Column B
Text Solution
|
- The inequation represented by the graph given below is : <img src="htt...
Text Solution
|
- The inequation that best describes the graph given below is <img src=...
Text Solution
|
- The inequation that best describes the following graph is <img src="h...
Text Solution
|
- The line graph shows the number of vacancies for sales officers in a c...
Text Solution
|
- The line graph shows the number of vacancies for sales officers in a c...
Text Solution
|
- निम्नलिखित रेखा आरेख किसी कंपनी की वर्ष 2001-2010 के दौरान वार्षिक बिक...
Text Solution
|
- The following line diagram shows the annual sales figures of a company...
Text Solution
|