A
B
C
D
Text Solution
Verified by Experts
The correct Answer is:


Similar Questions
Explore conceptually related problems
Recommended Questions
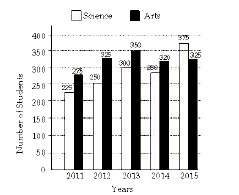
- The given Bar graph present the number of students from Science and Ar...
Text Solution
|
- The inequation represented by the graph given below is : <img src="htt...
Text Solution
|
- The inequation that best describes the graph given below is <img src=...
Text Solution
|
- The inequation that best describes the following graph is <img src="h...
Text Solution
|
- एक स्कुल में 40% विज्ञान के विद्यार्थी तथा शेष 60% कला के विद्यार्थी ह...
Text Solution
|
- The given Bar graph present the number of students from Science and Ar...
Text Solution
|
- The given Bar graph present the number of students from Science and Ar...
Text Solution
|
- What is the ratio of the total number of science students in 2011 and ...
Text Solution
|
- The given Bar graph present the number of students from Science and Ar...
Text Solution
|