A
B
C
D
Text Solution
Verified by Experts
The correct Answer is:


Similar Questions
Explore conceptually related problems
Recommended Questions
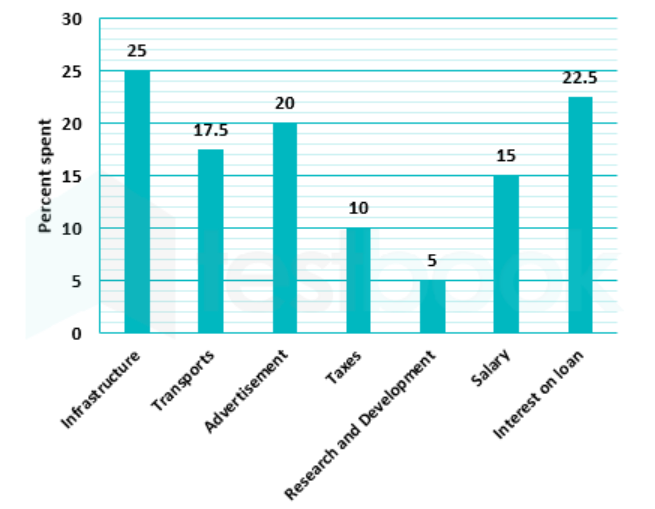
- The give graph represents the percentage distibution of the total expe...
Text Solution
|
- ग्राफ में किसी कम्पनी के मासिक व्यय को दर्शाया गया है। ग्राफ का अध्ययन...
Text Solution
|
- Match the following Column A to Column B
Text Solution
|
- The inequation represented by the graph given below is : <img src="htt...
Text Solution
|
- The inequation that best describes the graph given below is <img src=...
Text Solution
|
- The inequation that best describes the following graph is <img src="h...
Text Solution
|
- The bar diagram shows the monthly expenditure of a company. Study the ...
Text Solution
|
- Study the following graph carefully and answer the question IF to...
Text Solution
|
- Study the following graph and answer the question. Percentage distribu...
Text Solution
|