A
B
C
D
Text Solution
Verified by Experts
The correct Answer is:


Similar Questions
Explore conceptually related problems
Recommended Questions
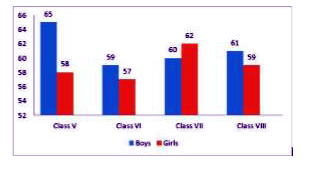
- The following graph shows the number of boys and girls in Class V, Cla...
Text Solution
|
- The ratio of boys and girls in a class is 5:3.20% of the boys and 60% ...
Text Solution
|
- Match the following Column A to Column B
Text Solution
|
- The inequation represented by the graph given below is : <img src="htt...
Text Solution
|
- The inequation that best describes the graph given below is <img src=...
Text Solution
|
- The inequation that best describes the following graph is <img src="h...
Text Solution
|
- एक सह शिक्षा माध्यमिक विधालय की प्रत्येक कक्षा में लड़कियों की संख...
Text Solution
|
- There are 42 boys and 18 girls in a class. What is the percentage of b...
Text Solution
|
- Answer the given question by studying the following bar graph carefull...
Text Solution
|