A
B
C
D
Text Solution
Verified by Experts
The correct Answer is:


Similar Questions
Explore conceptually related problems
Recommended Questions
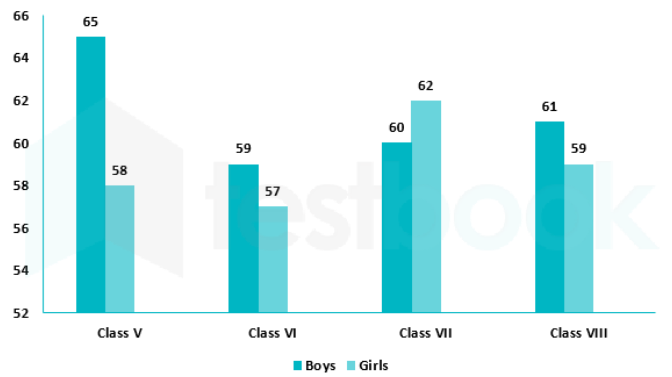
- The following graph shows the number of boys and girls in Class V, Cla...
Text Solution
|
- The number of girl students in each class of a co-educational middle ...
Text Solution
|
- The number of girl students in each class of co-ed. Middle school i...
Text Solution
|
- Match the following Column A to Column B
Text Solution
|
- The inequation represented by the graph given below is : <img src="htt...
Text Solution
|
- The inequation that best describes the graph given below is <img src=...
Text Solution
|
- The inequation that best describes the following graph is <img src="h...
Text Solution
|
- The number of girl students in each class of a co-educational middle ...
Text Solution
|
- The number of girl students in each class of co-ed. Middle school i...
Text Solution
|