A
B
C
D
Text Solution
Verified by Experts
The correct Answer is:


Similar Questions
Explore conceptually related problems
Recommended Questions
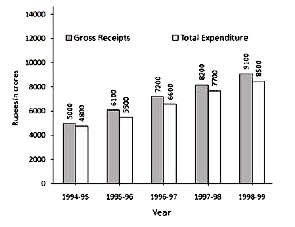
- Given bar graph shows, total expenditure and the gross receipts of a c...
Text Solution
|
- ग्राफ में किसी कम्पनी के मासिक व्यय को दर्शाया गया है। ग्राफ का अध्ययन...
Text Solution
|
- Following information is available for the year 2016-17, calculate gro...
Text Solution
|
- Match the following Column A to Column B
Text Solution
|
- The inequation represented by the graph given below is : <img src="htt...
Text Solution
|
- The inequation that best describes the graph given below is <img src=...
Text Solution
|
- The inequation that best describes the following graph is <img src="h...
Text Solution
|
- In the following questions are based on the following bar graph,Read t...
Text Solution
|
- In the following questions are based on the following bar graph,Read t...
Text Solution
|