A
B
C
D
Text Solution
Verified by Experts
The correct Answer is:


Similar Questions
Explore conceptually related problems
Recommended Questions
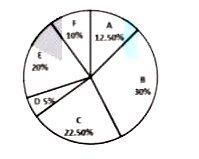
- The pie chart shows the annual car production (percentage wise) of six...
Text Solution
|
- The pie chart shows the annual car production of six countries (A,B,C,...
Text Solution
|
- The pie chart shows the annual car production of six countries (A,B,C...
Text Solution
|
- The pie chart shows the annual car production of six countries (A,B,C,...
Text Solution
|
- The table shows the production of different types of cars (in thousand...
Text Solution
|
- The table shows the production of different types of cars (in thousand...
Text Solution
|
- The table shows the production of different types of cars (in thousand...
Text Solution
|
- The table shows the production of different types of cars (in thousand...
Text Solution
|
- The given pie-chart shows the distribution (in degrees) of cars sold o...
Text Solution
|