A
B
C
D
Text Solution
Verified by Experts
The correct Answer is:


Similar Questions
Explore conceptually related problems
Recommended Questions
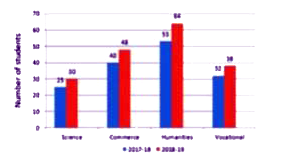
- The given bar graph represents the number of students who appeared in ...
Text Solution
|
- Match the following Column A to Column B
Text Solution
|
- The inequation represented by the graph given below is : <img src="htt...
Text Solution
|
- The inequation that best describes the graph given below is <img src=...
Text Solution
|
- The inequation that best describes the following graph is <img src="h...
Text Solution
|
- Find the total number of students who gave exams in February 2018. if ...
Text Solution
|
- The given bar graph represents the number of students who appeared in ...
Text Solution
|
- The given bar graph represents the number of students who appeared in ...
Text Solution
|
- The given bar graph represents the number of students who appeared in ...
Text Solution
|