A
B
C
D
Text Solution
AI Generated Solution


Similar Questions
Explore conceptually related problems
Recommended Questions
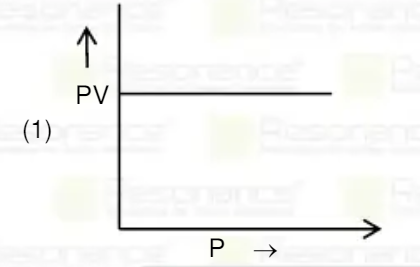
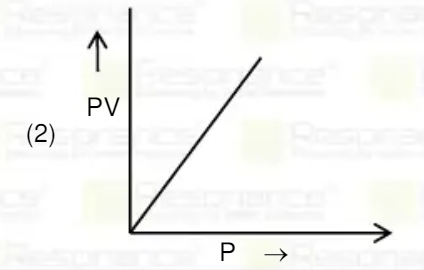
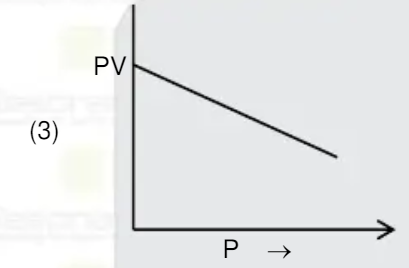
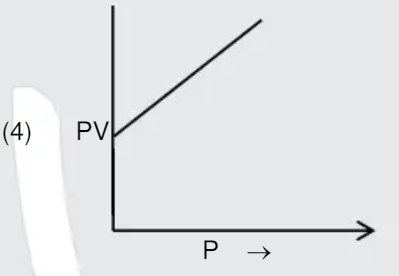
- At constant temperature for given amount of an ideal gas the correct g...
Text Solution
|
- Draw a graph of log P vs log (1/V) for a fixed amount of a gas at cons...
Text Solution
|
- The graph between PV vs P at constant temperature is linear parallel t...
Text Solution
|
- At low pressure, the graph of PV vs (1)/(V) for a given amount at a co...
Text Solution
|
- What is the nature of graph of PV versus P for a given mass of a gas a...
Text Solution
|
- At constant pressure for a given amount of an ideal gas, will the grap...
Text Solution
|
- What will the nature of PV vs P graph be for a real gas at Boyle tempe...
Text Solution
|
- Why is the PV vs P plot for an ideal gas at a given temperature parall...
Text Solution
|
- for a given mass of an ideal gas at constant temperature draw and expl...
Text Solution
|