A
B
C
D
Text Solution
AI Generated Solution


Similar Questions
Explore conceptually related problems
Recommended Questions
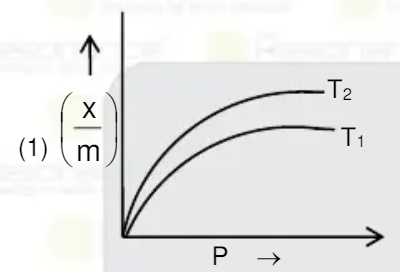
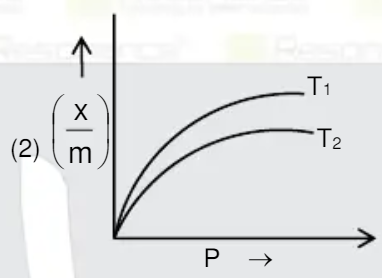
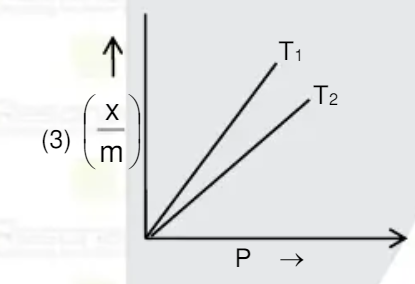
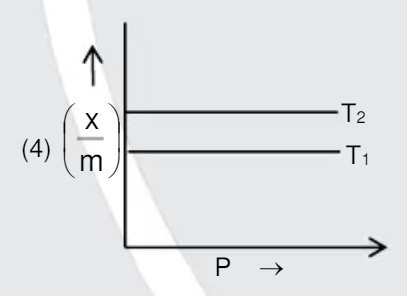
- The graph of (x/m) vs P at two different temperature T1 and T2 is [whe...
Text Solution
|
- The current - voltage graphs for a given metallic wire at two differen...
Text Solution
|
- The current voltage graphs for a given metalic wire two different temp...
Text Solution
|
- Two bodies at different temperatures T1 and T2 , if brought in thermal...
Text Solution
|
- দুটি ভিন্ন তাপমাত্রা T1 এবং T2 -তে ( T2gtT1 ) নির্দিষ্ট ভরের একটি আদর্...
Text Solution
|
- V-I graph for a mettalic wire at two different temperatures T1 and T2 ...
Text Solution
|
- Pressure (P) vs. density (D) curve for an ideal gas at two different t...
Text Solution
|
- Two different temperatures of an ideal gas T1 Oh T2 Pressure (P) vs. T...
Text Solution
|
- p - V diagram of same mass of a gas are drawn at two different tempera...
Text Solution
|