A
B
C
D
Text Solution
Verified by Experts
The correct Answer is:


Similar Questions
Explore conceptually related problems
Recommended Questions
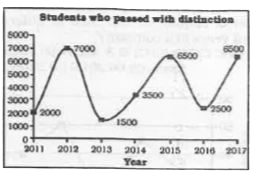
- The line graph shows the number of students who passed with distinctio...
Text Solution
|
- Study the following table and answer the questions वर्ष 2010 से 2...
Text Solution
|
- Match the following Column A to Column B
Text Solution
|
- The inequation represented by the graph given below is : <img src="htt...
Text Solution
|
- The inequation that best describes the graph given below is <img src=...
Text Solution
|
- The inequation that best describes the following graph is <img src="h...
Text Solution
|
- The line graph shows the number of students who passed with distinctio...
Text Solution
|
- The line graph shows the number of students who passed with distinctio...
Text Solution
|
- The line graph shows the number of students who passed with distinctio...
Text Solution
|