A
B
C
D
Text Solution
Verified by Experts


Similar Questions
Explore conceptually related problems
Recommended Questions
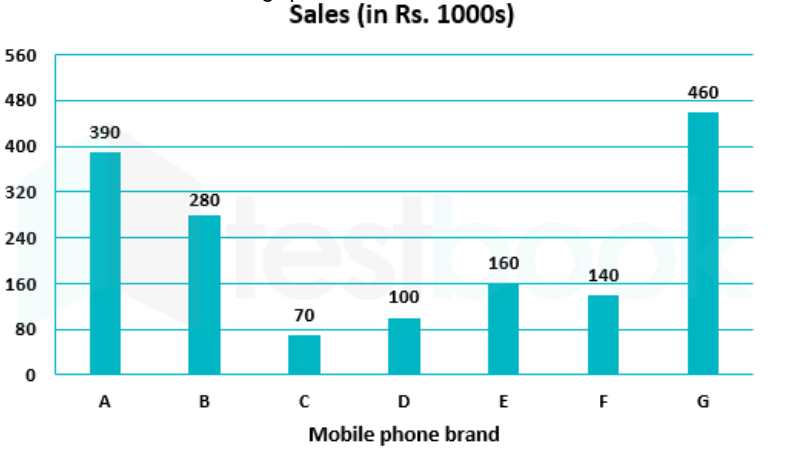
- The bar graph shows 1 month's sales figures of different brands of mob...
Text Solution
|
- The inequation that best describes the following graph is <img src="h...
Text Solution
|
- The bar graph shows 1 month's sales figures of different brands of ref...
Text Solution
|
- The bar graph shows 1 month's sales figure of different brands of refr...
Text Solution
|
- The bar graph shows 1 month's sales figure of different brands of refr...
Text Solution
|
- The bar graph shows 1 month's sales figure of different brands of refr...
Text Solution
|
- The bar graph shows 1 month's sales figures of different brands of mob...
Text Solution
|
- The bar graph shows 1 month's sales figures of different brands of mob...
Text Solution
|
- The bar graph shows 1 month's sales figures of different brands of mob...
Text Solution
|