A
B
C
D
Text Solution
Verified by Experts
The correct Answer is:


Similar Questions
Explore conceptually related problems
Recommended Questions
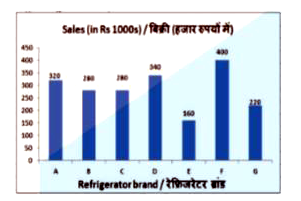
- The bar graph shows 1 month's sales figure of different brands of refr...
Text Solution
|
- एक रेफ्रीजरेटर 915 रु. में बिक्री कर सहित उपलब्ध है । यदि बिक्री कर की...
Text Solution
|
- एक रफ्रीजरेटर बिक्री कर सहित 14,168 रु. में उपलब्ध है । यदि बिक्री कर ...
Text Solution
|
- कांता 8,208 रु में एक फ्रिज खरीदती है जिसमे बिक्री कर भी शामिल है...
Text Solution
|
- The bar graph shows 1 month's sales figures of different brands of ref...
Text Solution
|
- The bar graph shows 1 month's sales figure of different brands of refr...
Text Solution
|
- The bar graph shows 1 month's sales figure of different brands of refr...
Text Solution
|
- The bar graph shows 1 month's sales figures of different brands of mob...
Text Solution
|
- The bar graph shows 1 month's sales figures of different brands of mob...
Text Solution
|