A
B
C
D
Text Solution
Verified by Experts
The correct Answer is:


Similar Questions
Explore conceptually related problems
Recommended Questions
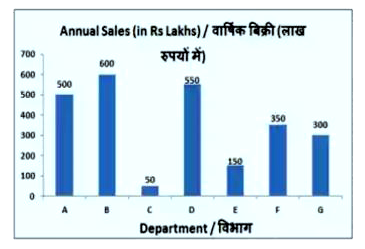
- The bar graph shows the annual sales of the different departments of a...
Text Solution
|
- The bar graph shows the monthly profits of the different departments o...
Text Solution
|
- The bar graph shows the monthly profits of the different departments o...
Text Solution
|
- The bar graph shows the monthly profits of the different departments o...
Text Solution
|
- यह दण्ड आरेख एक कंपनी के विभिन्न के मासिक लाभ को दर्शाता है। किस ...
Text Solution
|
- यह दण्ड आरेख एक कंपनी के विभिन्न के मासिक लाभ को दर्शाता है। विभा...
Text Solution
|
- This bar diagram shows the monthly profit of various companies of a co...
Text Solution
|
- This bar diagram shows the monthly profit of various companies of a co...
Text Solution
|
- निम्नलिखित रेखा आरेख किसी कंपनी की वर्ष 2001-2010 के दौरान वार्षिक बिक...
Text Solution
|