A
B
C
D
Text Solution
Verified by Experts
The correct Answer is:


Similar Questions
Explore conceptually related problems
Recommended Questions
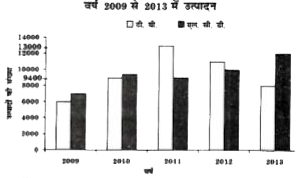
- Study the following bar diagram carefully and answer the following que...
Text Solution
|
- संलग्न चित्र में, यदि धारामापी G में कोई विक्षेप नहीं हैं तो एक दशा मे...
Text Solution
|
- किसी स्थान पर पृथ्वी के चुम्बकीय क्षेत्र का क्षैतिज घटक 0.3xx10^(-4)" ...
Text Solution
|
- ट्रांसफॉर्मर का नामांकित चित्र तथा इसके परिणमन अनुपात का सूत्र...
Text Solution
|
- समस्याओ में रैखिक समीकरणो के युग्म बनाइए और अनके हल ( यदि उनक...
Text Solution
|
- घनीय संकुलन में संकुलित परमाणुओं तथा चतुष्फलकीय रिक्तियों का अनुपात है...
Text Solution
|
- AgBr तथा ZnS क्रिस्टल तंत्र में निम्न में से कौन-सा दोष पाया जाता है ?
Text Solution
|
- (dy)/(dx)=1+x+y+xy" का हल है "
Text Solution
|
- निम्नलिखित कथनों पर विचार करें : कथन I : veca=2veci-3vecj+veck" और "...
Text Solution
|