Home
Class 14
REASONING
Study the graph and answer the questions...

Study the graph and answer the questions.
ग्राफ का अध्ययन कीजिए और दिये गये प्रश्नों के उत्तर दीजिए:

In case of which soft drink was the average annual sale maximum during the period 1988-1993 ?
किस सॉफ्ट ड्रिंक के मामले में, 1988-1993 की अवधि में औसत वार्षिक बिक्री अधिकतम थी?

A

केवल पेप-अप

B

पेप-अप और ड्यू-ड्रॉप

C

केवल कूल-सिप

D

कूल-सिप और पेप-अप

Text Solution

Verified by Experts

The correct Answer is:
A

वर्ष 1988-93 की अवधि के दौरान वार्षिक औसत बिक्री कुल सीप =`(25+6+19+15+25+30)/(6)`
= 20लाख बोतल
पेप - अप `=(30+35+30+25+20+20)/(6)`
`= 26(2)/(3)` लाख बोतल
अतः केवल पेप-अप की औसत वार्षिक बिक्री अधिकतम थी।
Promotional Banner

Similar Questions

Explore conceptually related problems

Study the graph and answer the questions. ग्राफ का अध्ययन कीजिए और दिये गये प्रश्नों के उत्तर दीजिए: In case of which soft drink was the average annual sale minimum during the period 1988-1993 ? किस सॉफ्ट ड्रिंक के मामले में 1988-1993 की अवधि में औसत वार्षिक बिक्री सबसे कम रही?

Study the graph and answer the questions. In case of which soft drink was the average annual sale maximum during the period 1988 - 1993 ?

Study the graph and answer the questions. In case of which soft drink was the average annual sale minimum during the period 1988- 1993 ?

Study the graph and answer the questions. ग्राफ का अध्ययन कीजिए और दिये गये प्रश्नों के उत्तर दीजिए: In which year the sale of cool sip is minimum? कूल-सिप की बिक्री सबसे कम किस वर्ष हुई?

Study the graph and answer the questions. ग्राफ का अध्ययन कीजिए और दिये गये प्रश्नों के उत्तर दीजिए: In which year sale of Dew-drop is maximum ? ड्यू-ड्रॉप की बिक्री किस वर्ष सबसे अधिक रही?

Study the graph and answer the questions. ग्राफ का अध्ययन कीजिए और दिये गये प्रश्नों के उत्तर दीजिए: What was the approximate percent increase in sales of Cool-sip in 1990 over its sales in 1989 ? कूल-सिंप की 1989 में बिक्री की तुलना में 1990 में बिक्री में लगभग कितने प्रतिशत की बढ़ोतरी हुई?

Study the following graph and answer the given questions: निम्न ग्राफ का अध्ययन कीजिए और दिये गये प्रश्नों के उत्तर दीजिए: From year 1995 to the year 1996, what was the percentage increase in imports of crude oil? वर्ष 1995 से वर्ष 1996 तक क्रूड ऑयल के आयात में कितने प्रतिशत वृद्धि हुई?

Study the following graph and answer the given questions: निम्न ग्राफ का अध्ययन कीजिए और दिये गये प्रश्नों के उत्तर दीजिए: From 1991 to 1992, what was the approximate percentage reduction in import of crude oil? वर्ष 1991 से 1992 तक क्रूड ऑयल के आयात में लगभग कितने प्रतिशत कमी रही?

Recommended Questions
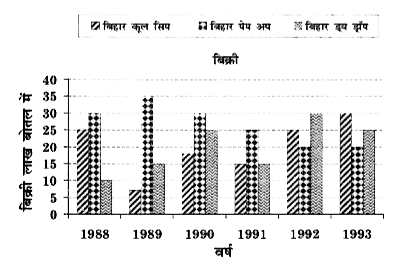
  1. Study the graph and answer the questions. ग्राफ का अध्ययन कीजिए और द...

    Text Solution

    |

  2. एक संक्रमण धातु की अधिकतम ऑक्सीकरण अवस्था प्राप्त करने में कौन-से इलेक...

    Text Solution

    |

  3. डार्विन के जैव-विकास के सिद्धांत में सबसे बड़ी कमी किस चीज की जानकारी न...

    Text Solution

    |

  4. भोपाल गैस त्रासदी किस गैस के कारण हुई थी ?

    Text Solution

    |

  5. संलग्न चित्र में, यदि धारामापी G में कोई विक्षेप नहीं हैं तो एक दशा मे...

    Text Solution

    |

  6. धारामापी , अमीटर एवं वोल्टमीटर में से किसका प्रतिरोध अधिकतम तथा किसका ...

    Text Solution

    |

  7. किसी स्थान पर पृथ्वी के चुम्बकीय क्षेत्र का क्षैतिज घटक 0.3xx10^(-4)" ...

    Text Solution

    |

  8. प्रत्यावर्ती परिपथ के लिए औसत शक्ति का व्यंजक प्राप्त कीजिए तथा...

    Text Solution

    |

  9. प्रत्यावर्ती धारा स्त्रोत की आवृत्ति बदलने पर प्रेरण प्रतिघात त...

    Text Solution

    |