A
B
C
D
Text Solution
Verified by Experts
The correct Answer is:


Recommended Questions
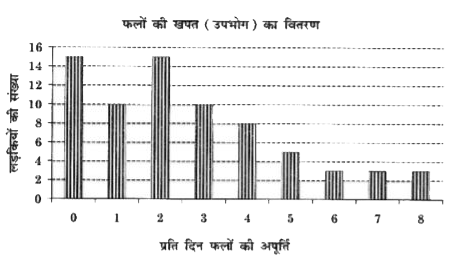
- The distribution of fruit consumption in a sample of 73 seventeen-year...
Text Solution
|
- Determine the point of symmetry of a regular hexagon. <img src="htt...
Text Solution
|
- Match the following Column A to Column B
Text Solution
|
- Match the following Column A to Column B
Text Solution
|
- Match the following Column A to Column B
Text Solution
|
- The inequation represented by the graph given below is : <img src="htt...
Text Solution
|
- The inequation that best describes the graph given below is <img src=...
Text Solution
|
- The inequation that best describes the following graph is <img src="h...
Text Solution
|
- Direction : The distribution of fruit consumption in a sample of 72 se...
Text Solution
|