Home
Class 14
MATHS
निम्नलिखित पाई चार्ट कर्मचारी चयन आयोग, ...

निम्नलिखित पाई चार्ट कर्मचारी चयन आयोग, कोलकाता के 1400 अधिकारियों के लिए परिवहन माध्यमों को दर्शाता है। चार्ट का अध्ययन कीजिए एवं प्रश्नों का उत्तर दीजिए :

The ratio of two-wheelers and cars being used as modes of transport is.
परिवहन माध्यमों के रूप में प्रयुक्त दुपहिया वाहनों और कारों का अनुपात क्या है?

A

`4:7`

B

`7:5`

C

`5:7`

D

`3:5`

Text Solution

Verified by Experts

The correct Answer is:
C

अभीष्ट अनुपात = 15 : 21
= 5 : 7
Promotional Banner

Similar Questions

Explore conceptually related problems

निम्नलिखित पाई चार्ट कर्मचारी चयन आयोग, कोलकाता के 1400 अधिकारियों के लिए परिवहन माध्यमों को दर्शाता है। चार्ट का अध्ययन कीजिए एवं प्रश्नों का उत्तर दीजिए : Write down the difference : (officers availing train - officers availaing car) रेलगाड़ी से जाने वाले अधिकारियों तथा कार से जाने वाले अधिकारियों की संख्या का अंतर बताइए।

The given pie chart shows the percentage distribution of 450 employees in an organization. Study the pie chart and answer the questions that follow दिए गए पाई चार्ट एक संगठन में 450 कर्मचारियों के प्रतिशत को दर्शाता है। पाई चार्ट का अध्ययन करें और आने वाले प्रश्नों का उत्तर दें। What is the central angle of the sector representing the number of employees in department A? विभाग A में कर्मचारियों की संख्या का प्रतिनिधित्व करने वाले क्षेत्र का केंद्रीय कोण क्या है?

The pie-chart provided below gives the distribution of land (in a village) under various food crops. Study the pie-chart carefully and answer the questions. नीचे दिए गए वृत्तारेखा में विभिन खाद्य फसलों के ( एक गाँव में ) भूमि का वितरण दिखाया गया हैं। वृत्तारेखा का अध्ययन कीजिए और प्रश्नों के उत्तर दीजिए। The ratio of the land used for rice and barley is चावल और जौ के उत्पादन के लिए प्रयुक्त भूमि का अनुपात है-

The sub divided bar diagram given below depicts the result of class XII students of a school for three years. Study the diagram and answer the questions given below. निम्नलिखित दण्ड आरेख तीन वर्षों के लिए एक स्कूल के कक्षा XII के छात्रों का परीक्षा परिणाम दिखाता है। दण्ड आरेख का अध्ययन कीजिए और निम्नलिखित प्रश्नों का उत्तर दीजिए : The percentage of students passed with First class in the year 2001 is. वर्ष 2001 में प्रथम श्रेणी में उत्तीर्ण हुए छात्रों का प्रतिशत है?

The sub divided bar diagram given below depicts the result of class XII students of a school for three years. Study the diagram and answer the questions given below. निम्नलिखित दण्ड आरेख तीन वर्षों के लिए एक स्कूल के कक्षा XII के छात्रों का परीक्षा परिणाम दिखाता है। दण्ड आरेख का अध्ययन कीजिए और निम्नलिखित प्रश्नों का उत्तर दीजिए : The percentage of students passed with First class in the year 2001 is. वर्ष 2001 में प्रथम श्रेणी में उत्तीर्ण हुए छात्रों का प्रतिशत है?

The following line diagram represents the yearly sales figure of a company in the years 2001-2010. Examine the diagram and answer the question. निम्नलिखित रेखा आरेख किसी कंपनी की वर्ष 2007-2010 के दौरान वार्षिक बिक्री के आंकड़ों को दर्शाता है। आरेख का अध्ययन करें और नीचे दिए गए प्रश्नों के उत्तर दें- The ratio of sales in 2002 to that in 2007 is वर्ष 2002 में बिक्री का वर्ष 2007 में बिक्री के साथ अनुपात है-

The following graph shows the sales of cars (in thousands) in four cities in 4 years. Study the graph and answer the questions. निम्नलिखित आरेख 4 वर्षों में चार शहरों में कारों की बिक्री (हज़ार में) को दर्शाता है। इस आरेख का अध्ययन कीजिए तथा प्रश्नों के उत्तर दीजिए। In 2019, what is the average number of sales among all the four cities? 2019 में, सभी चार शहरों में औसत बिक्री कितनी रही है?

The sub divided bar diagram given below depicts the result of class XII students of a school for three years. Study the diagram and answer the questions given below. निम्नलिखित दण्ड आरेख तीन वर्षों के लिए एक स्कूल के कक्षा XII के छात्रों का परीक्षा परिणाम दिखाता है। दण्ड आरेख का अध्ययन कीजिए और निम्नलिखित प्रश्नों का उत्तर दीजिए : The percentage of students passed with Second class in the year 2000 is वर्ष 2000 में द्वितीय श्रेणी में उत्तीर्ण हुए छात्रों का प्रतिशत है:

The sub divided bar diagram given below depicts the result of class XII students of a school for three years. Study the diagram and answer the questions given below. निम्नलिखित दण्ड आरेख तीन वर्षों के लिए एक स्कूल के कक्षा XII के छात्रों का परीक्षा परिणाम दिखाता है। दण्ड आरेख का अध्ययन कीजिए और निम्नलिखित प्रश्नों का उत्तर दीजिए : The percentage of students passed with Second class in the year 2000 is वर्ष 2000 में द्वितीय श्रेणी में उत्तीर्ण हुए छात्रों का प्रतिशत है:

The following pie-chart shows the monthly expenditure of a family on various items. If the family spends Rs. 825 on clothing, answer the question. निम्नलिखित पाई-चार्ट में किसी परिवार के विभिन्न मदों पर होने वाले खर्च का दर्शाया गया है। यदि परिवार वस्त्रों पर 825 रू खर्च करे तो प्रश्न का उत्तर दीजिए। What is the ratio of expenses on food and miscellaneous ? भोजन और विविध मदों पर होने वाले खर्च के बीच का क्या अनुपात है?

Recommended Questions
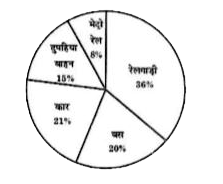
  1. निम्नलिखित पाई चार्ट कर्मचारी चयन आयोग, कोलकाता के 1400 अधिकारियों के ...

    Text Solution

    |

  2. Match the following Column A to Column B

    Text Solution

    |

  3. निचे दिये गये ग्राफ में दो प्रकार के वाहनों A व B के छ वर्षो के प्रद...

    Text Solution

    |

  4. निचे दिये गये ग्राफ में दो प्रकार के वाहनों A व B के छ वर्षो के प्रद...

    Text Solution

    |

  5. निचे दिये गये ग्राफ में दो प्रकार के वाहनों A व B के छ वर्षो के प्रद...

    Text Solution

    |

  6. निचे दिये गये ग्राफ में दो प्रकार के वाहनों A व B के छ वर्षो के प्रद...

    Text Solution

    |

  7. निचे दिये गये ग्राफ में दो प्रकार के वाहनों A व B के छ वर्षो के प्रद...

    Text Solution

    |

  8. निचे दिये गये ग्राफ में दो प्रकार के वाहनों A व B के छ वर्षो के प्रद...

    Text Solution

    |

  9. निम्नलिखित प्रश्नों के उत्तर दीजिए- 1857 की तोप का क्या आशय है?

    Text Solution

    |