A
B
C
D
Text Solution
Verified by Experts
The correct Answer is:


Similar Questions
Explore conceptually related problems
Recommended Questions
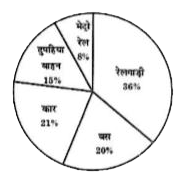
- निम्नलिखित पाई चार्ट कर्मचारी चयन आयोग, कोलकाता के 1400 अधिकारियों के ...
Text Solution
|
- Determine the point of symmetry of a regular hexagon. <img src="htt...
Text Solution
|
- Match the following Column A to Column B
Text Solution
|
- The inequation represented by the graph given below is : <img src="htt...
Text Solution
|
- The inequation that best describes the graph given below is <img src=...
Text Solution
|
- The inequation that best describes the following graph is <img src="h...
Text Solution
|
- निम्नलिखित प्रश्नों में से किन्हीं दो प्रश्नों के उत्तर लिखिए। प्रत्ये...
Text Solution
|
- यदि O मूल बिन्दु तथा A(a,b,c) है तो A से जाने वाले एवं OA लम्ब समतल का...
Text Solution
|
- समतल|अभिलम्ब रूप में समतल का समीकरण#!#एक दिए गए सदिश के अनुलम्ब एवं दि...
Text Solution
|