A
B
C
D
Text Solution
Verified by Experts
The correct Answer is:


Recommended Questions
- The percentage of the total production of flavour R in 2007 and 2008 w...
Text Solution
|
- For which of the following pairs of years the total exports from th...
Text Solution
|
- The bar chart given below shows the percentage distribution of the pro...
Text Solution
|
- The cost of the living index for 2008, taking 2007 as the base year, i...
Text Solution
|
- Determine the point of symmetry of a regular hexagon. <img src="htt...
Text Solution
|
- Match the following Column A to Column B
Text Solution
|
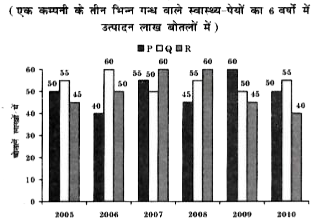
- A health drink company prepares the drinks of three different flavours...
Text Solution
|
- Study the following graph which shows the production (in thousand) of ...
Text Solution
|
- The following line diagram represents the yearly sales figure of a com...
Text Solution
|