Home
Class 14
REASONING
The least number of students got the mar...


The least number of students got the marks in the interval.
किस अंतराल में अंक प्राप्त करने वाले विद्यार्थियों की न्यूनतम संख्या थी?

A

40-50

B

20-30

C

`10-20`

D

0-10

Text Solution

Verified by Experts

The correct Answer is:
D

0-10 अंतराल में अंक प्राप्त करने वाले विद्यार्थियों की संख्या न्यूनतम थी।
Promotional Banner

Similar Questions

Explore conceptually related problems

The ratio of the students obtaining marks in the first and the last interval is. प्रथम और अंतिम अंतराल से अंक प्राप्त करने वाले विद्यार्थियों का अनुपात बताइए।

The given histogram shows the height of the students: दिए गए हिस्टोग्राम छात्रों की लम्बाई को दर्शाता है The number of students whose height is in the class interval 165-170 is what percentage less than the number of students whose height is in the interval 150-155? कक्षा अंतराल 165-170 में जिन छात्रों की लम्बाई है, उन छात्रों की संख्या प्रतिशत में कितना कम है लम्बाई अंतराल 150-155 से ज्ञात करे |

The given Bar Graph presents the results in terms of the number of students in a school for the five academic years, 2013-2014 to 2017-2018. दिया गया दंड आरेख (बार ग्राफ) पाँच शैक्षणिक वर्षों , 2013-2014 से 2017-2018 तक, के दौरान एक स्कूल के परीक्षाफल के संदर्भ में विधाथ्थियों की संख्या को दर्शाता है। What is the average number of students who passed in the five academic years? पाँच शैक्षणिक वर्षो में उत्तीर्ण होने वाले विद्यार्थियों की संख्या क्या है।

The given Bar Graph presents the results in terms of the number of students in a school for the five academic years, 2013-2014 to 2017-2018. दिया गया दंड आरेख पांच शैक्षणिक वर्षों : 2013-2014 से 2017-2018 तक एक विद्यालय में छात्रों की संख्या के संदर्भ में परिणामों को प्रस्तुत करता है | What is the average number of students who passed in the five academic years? पांच शैक्षणिक वर्षों में पास करने वाले छात्रों की औसत संख्या कया है ?

The table given below shows the number of students having obtained different marks नीचे दी गयी तालिका अलग-अलग अंक प्राप्त करने वाले छात्रों की संख्या को दर्शाती है | What is the mean marks per student ? प्रति छात्र माध्य अंक कितना है ?

Study the given histogram that shows the marks obtained by students in an examination and answer the question that follows: दिए गए हिस्टोग्राम का अध्ययन करें जो एक परीक्षा में छात्रों द्वारा प्राप्त किए गए अंकों को दिखाता है और निम्न प्रश्न का उत्तर दे| The number of students who obtained less than 200 marks is: 200 से कम अंक प्राप्त करने वाले छात्रों की संख्या है:

The given graph shows the marks obtained by students in an examination. दिया गया आरेख किसी परीक्षा में छात्रों के प्राप्तांक दर्शाता है | The number of students who obtained less than 300 marks is what percent more than the number of students who obtained 350 or more marks? 300 अंक से कम प्राप्त करने वाले छात्रों की संख्या 350 या इससे अधिक अंक प्राप्त करने वाले छात्रों की संख्या से कितना प्रतिशत अधिक है ?

Study the given histogram that shows the marks obtained by students in an examination and answer the question that follows: दिए गए हिस्टोग्राम का अध्ययन करें जो एक परीक्षा में छात्रों द्वारा प्राप्त किए गए अंकों को दिखाता है और निम्न प्रश्न का उत्तर दे| The number of students who obtained less than 250 marks is what percent more than the number of student who obtained 400 or more marks ?(correct to one decimal place) 250 से कम अंक प्राप्त करने वाले छात्रों की संख्या 490 या अधिक अंक प्राप्त करने वाले छात्र की संख्या से कितने प्रतिशत अधिक है? (एक दशमलव तक)

The given Bar Graph presents the number of students of two schools for six years. दिया गया दंड आरेख (बार ग्राफ) छह वर्षो के दौरान दो स्कूलों में विद्यार्थियों की संख्या को दर्शाता है| What is the average of the number of students from school A during the six year period? छह वर्षों की अवधि के दौरान स्कूल A के विद्यार्थियों की औसत संख्या क्या है?

The given Bar Graph presents the number of students of two schools for six years. दिया गया दंड आरेख (बार ग्राफ) छह वर्षो के दौरान दो स्कूलों में विद्यार्थियों की संख्या को दर्शाता है| In which year, the percentage increase in students in school B is the highest in comparison to its previous year? किस वर्ष में, स्कूल B के विद्यार्थियों की संख्या में प्रतिशत वृद्धि इसके पिछले वर्ष की तुलना में सबसे अधिक है?

Recommended Questions
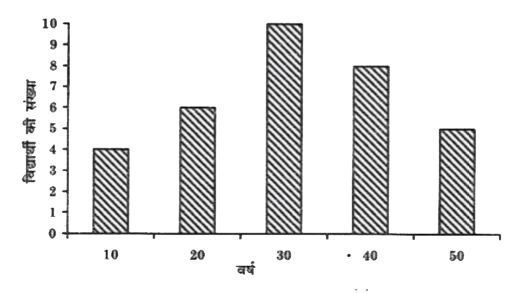
  1. The least number of students got the marks in the interval. किस अंतर...

    Text Solution

    |

  2. Fe^(3+) में अनुगमित एलेक्ट्रॉनों की संख्या है-

    Text Solution

    |

  3. एक कक्षा के छात्रों को पंक्ति में खड़ा किया जाता है। यदि प्रत्येक पंक्...

    Text Solution

    |

  4. एक परीक्षा में पास होने वाले तथा पेल होने वालो का अनुपात 3 : 1 था। यदि...

    Text Solution

    |

  5. समस्याओ में रैखिक समीकरणो के युग्म बनाइए और अनके हल ( यदि उनक...

    Text Solution

    |

  6. एक के विद्यार्थियों क्रो पंकितियों में खड़ा होना है। यदि पक्ति में...

    Text Solution

    |

  7. यदि 4 सिक्कों को एक साथ उछाला जाय, तो कम से कम एक पुच्छ आने की प्रायिक...

    Text Solution

    |

  8. एक पाँसे को पाँच बार यदृच्छया फेंका जाता है। प्रायिकता ज्ञात कीजिये यद...

    Text Solution

    |

  9. गोलों के 3D-घनीय निबिड संकुलन में प्रत्येक गोले की उपसहसंयोजन संख्या ह...

    Text Solution

    |