A
B
C
D
Text Solution
Verified by Experts
The correct Answer is:


Recommended Questions
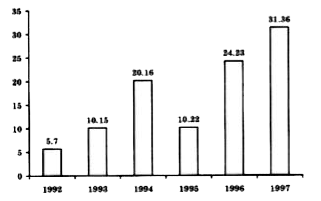
- Study the Bar diagram carefully and answer the question. The Bar diagr...
Text Solution
|
- बार हाफ में समस्त विश्व से भारत में विदेशी प्रत्यक्ष निवेश (एफ़ डी आई )...
Text Solution
|
- बार हाफ में समस्त विश्व से भारत में विदेशी प्रत्यक्ष निवेश (एफ़ डी आई )...
Text Solution
|
- बार हाफ में समस्त विश्व से भारत में विदेशी प्रत्यक्ष निवेश (एफ़ डी आई )...
Text Solution
|
- बार हाफ में समस्त विश्व से भारत में विदेशी प्रत्यक्ष निवेश (एफ़ डी आई )...
Text Solution
|
- वर्ष 2017 में लागू नीति के अनुसार, भारत में रक्षा क्षेत्र में कित...
Text Solution
|
- Direction : Study the following bar diagram carefully and answer the f...
Text Solution
|
- Direction : Study the following bar diagram carefully and answer the f...
Text Solution
|
- FDI (Foreign Direct Investment) attracted by globalisation in India be...
Text Solution
|