A
B
C
D
Text Solution
Verified by Experts
The correct Answer is:


Recommended Questions
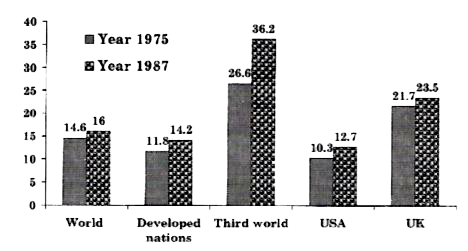
- Study the following Bar graph and answer the question. The Bar graph g...
Text Solution
|
- निम्नलिखित में से कौन - सा योगिक रंजक परीक्षण देता हैं ?
Text Solution
|
- किसी स्थान पर पृथ्वी के चुम्बकीय क्षेत्र का क्षैतिज घटक 0.3xx10^(-4)" ...
Text Solution
|
- A .C स्त्रोत की आवृत्ति में परिवर्तन के साथ संधारित्र प्रतिघात ...
Text Solution
|
- प्रत्यावर्ती धारा स्त्रोत की आवृत्ति बदलने पर प्रेरण प्रतिघात त...
Text Solution
|
- आयनिक ठोसों के लिए जिसमे धनायन तथा ऋणायन प्रबल वैधुतक्षैतिज बल के द्वा...
Text Solution
|
- AgBr तथा ZnS क्रिस्टल तंत्र में निम्न में से कौन-सा दोष पाया जाता है ?
Text Solution
|
- (dy)/(dx)=1+x+y+xy" का हल है "
Text Solution
|
- अंतराल [-1,1]" में "f(x)=x^(2)-1 के लिए रोली प्रमेय से c का मान है
Text Solution
|