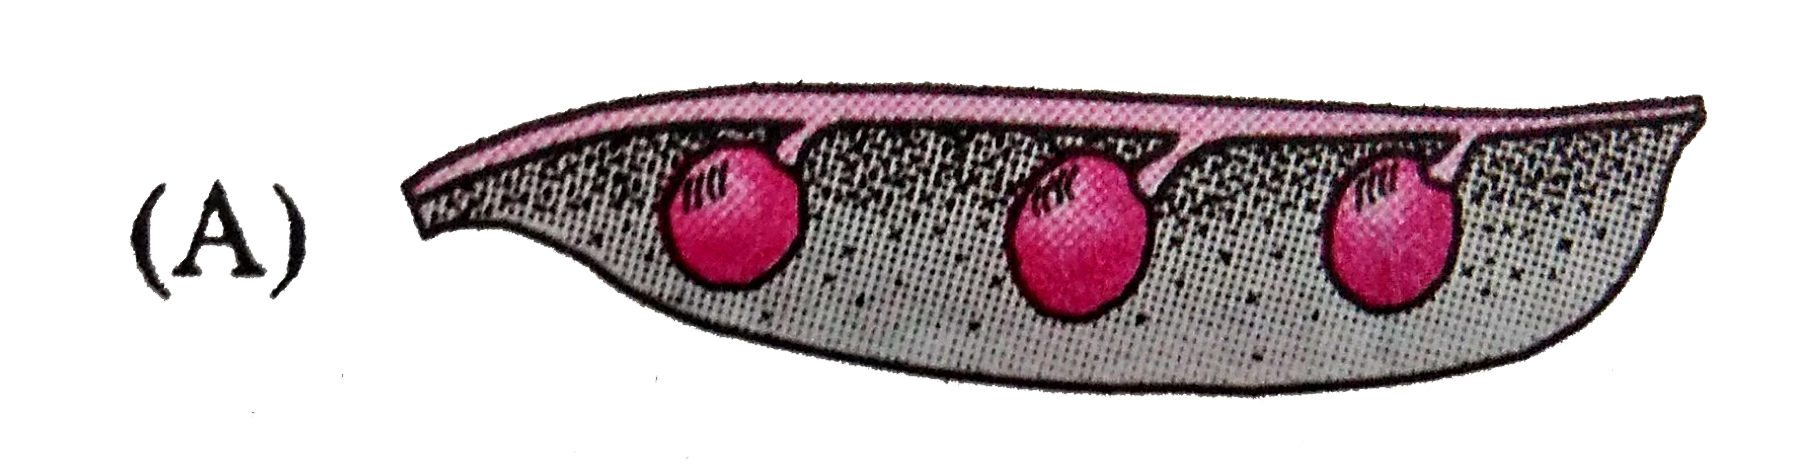
A
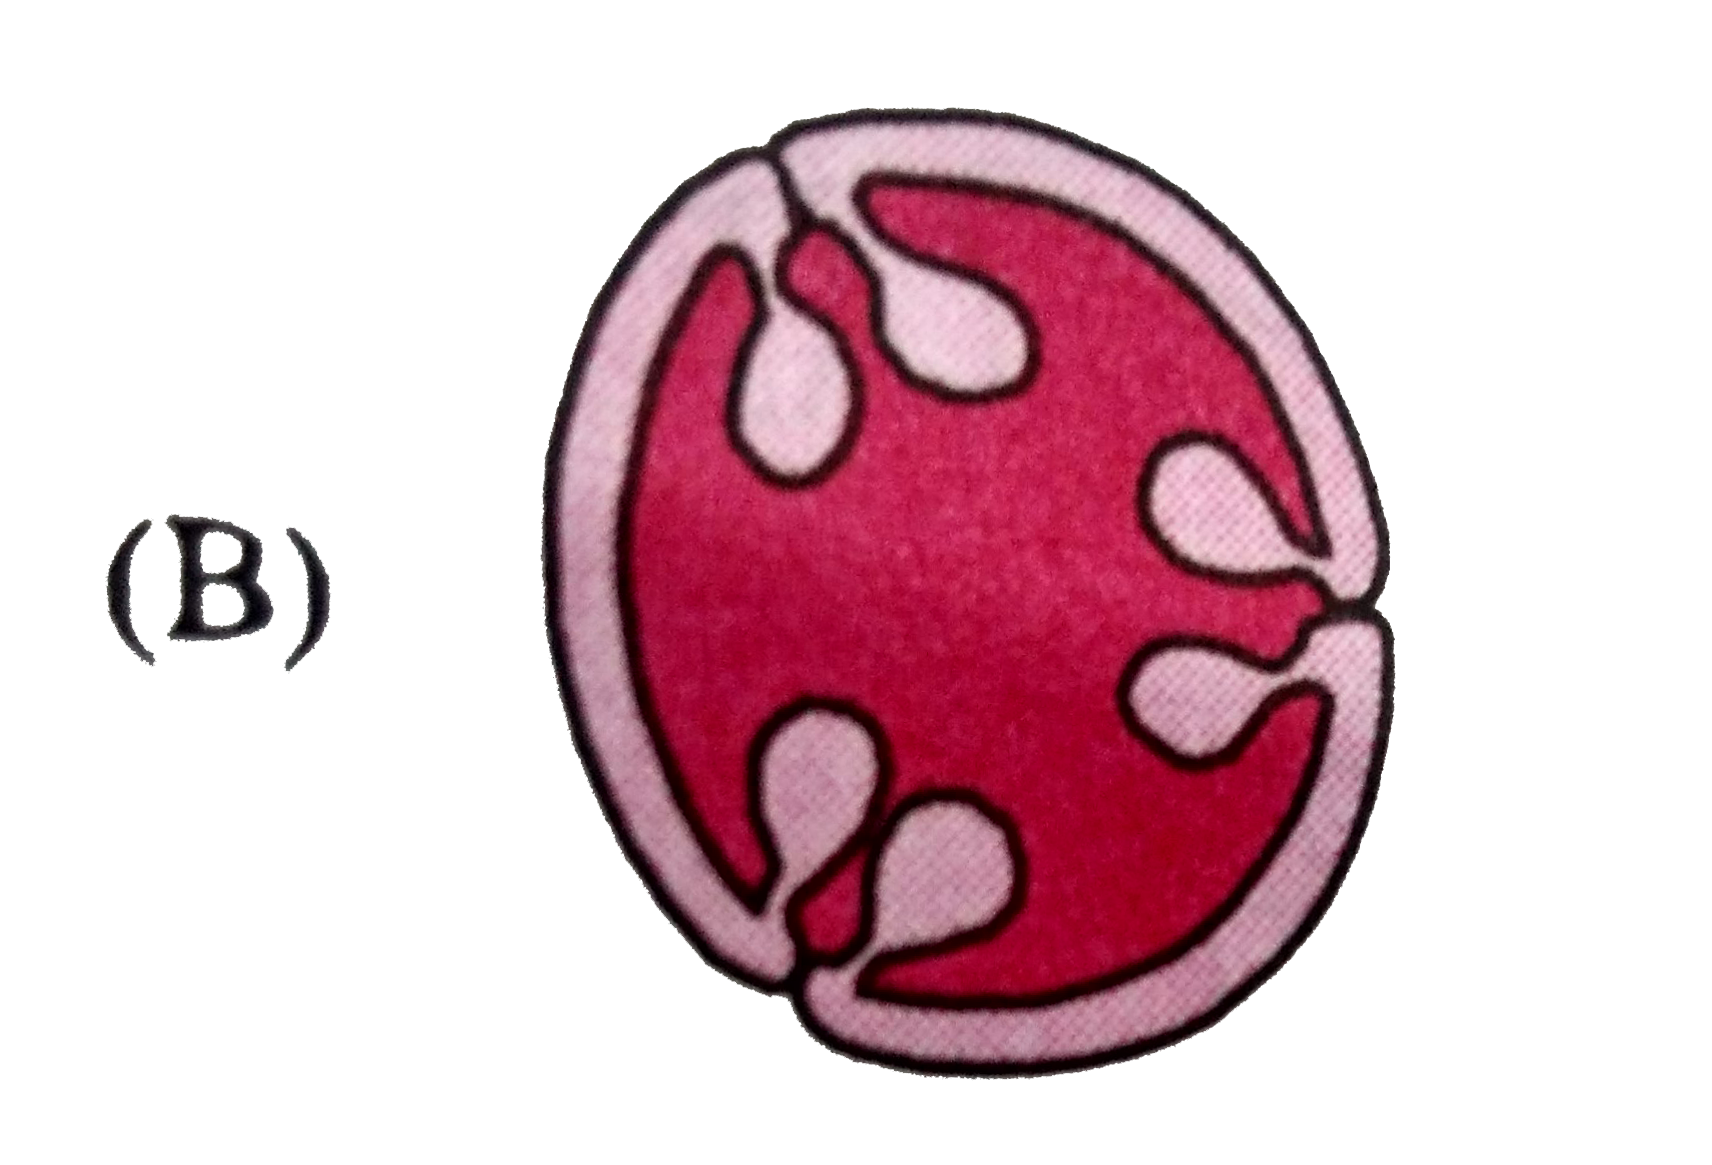
B
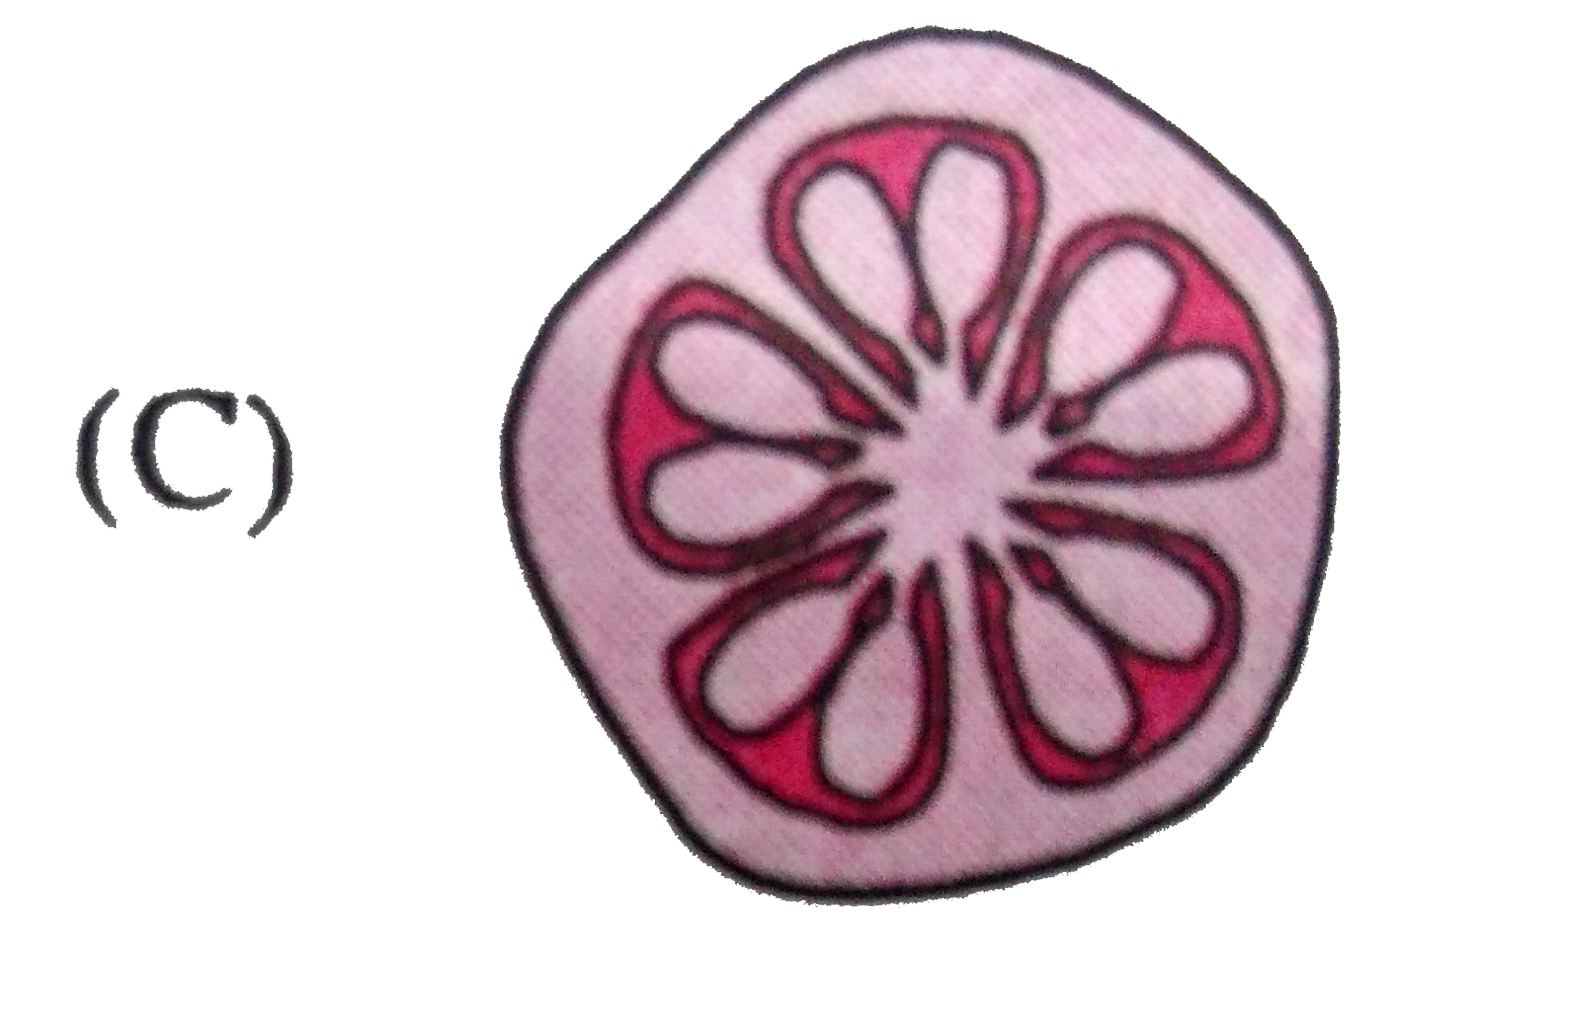
C
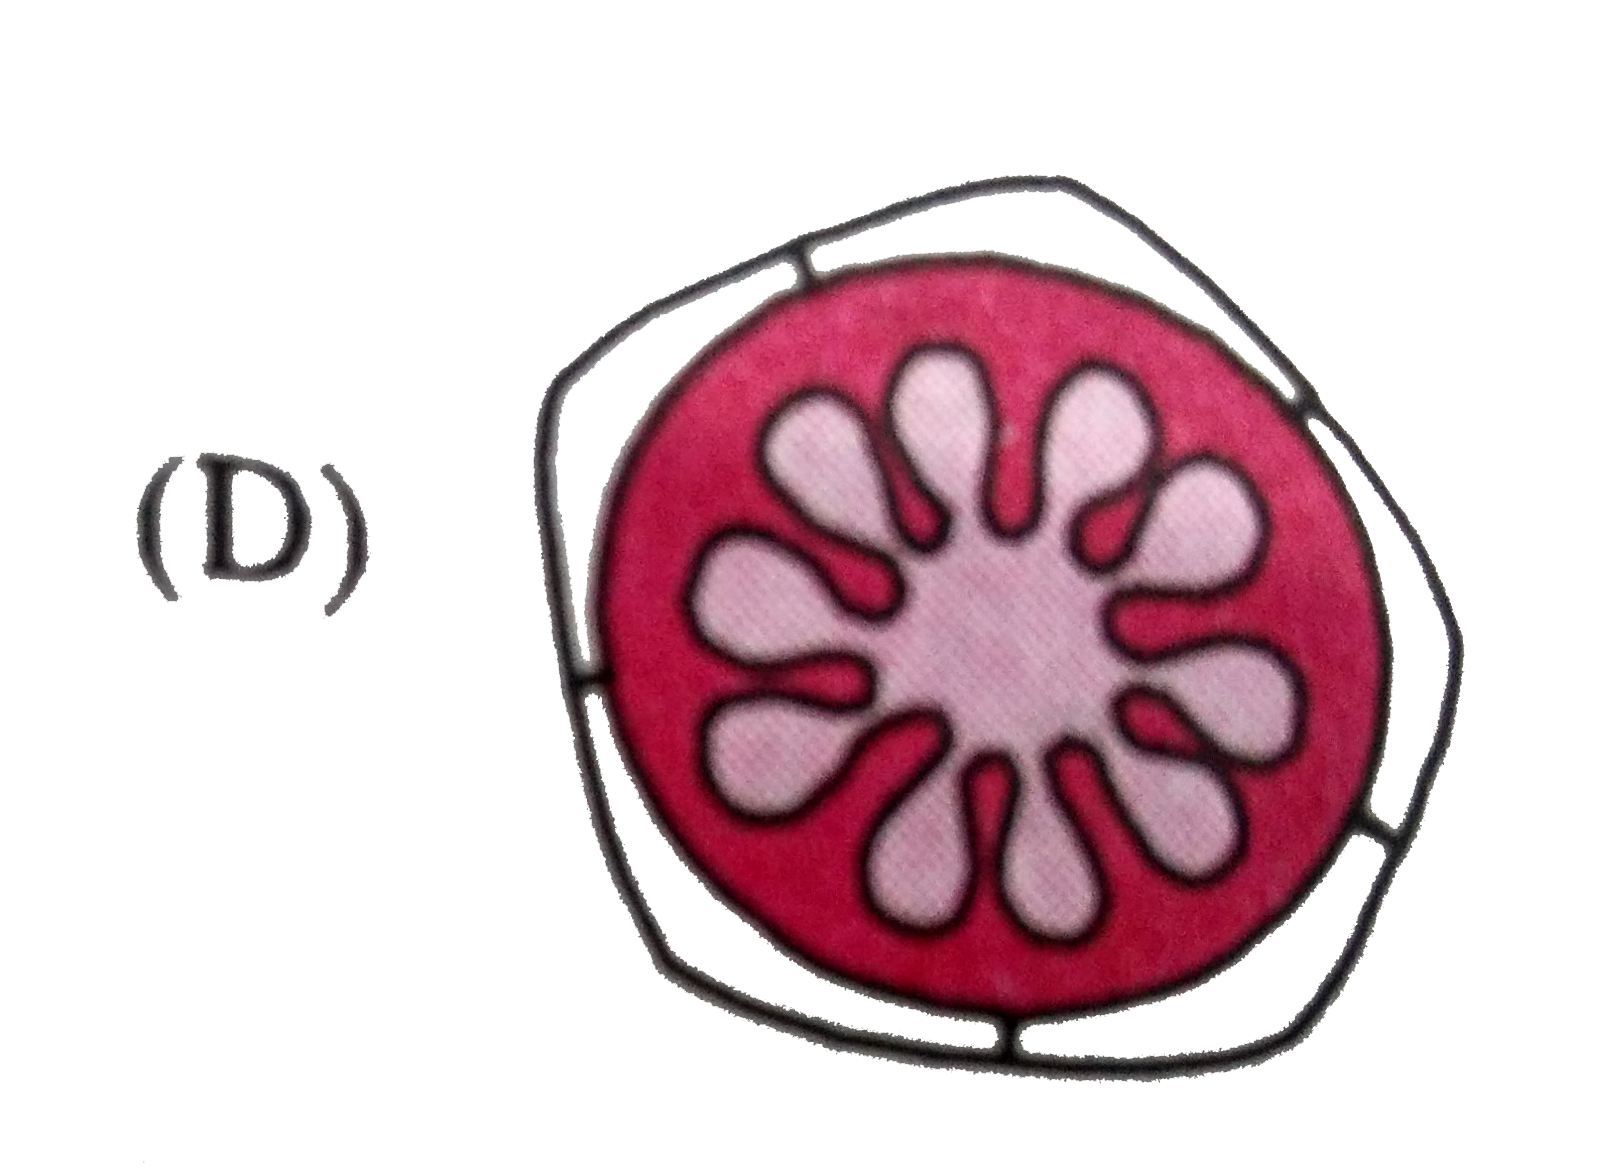
D
Text Solution
Verified by Experts
The correct Answer is:


Similar Questions
Explore conceptually related problems
Recommended Questions
- Which one of the following diagrams represent the placentation in Dian...
Text Solution
|
- In the diagram of types of placentation a, b, c and d represent
Text Solution
|
- Which one represents placentation in dianthus
Text Solution
|
- In Dianthus, placentation is
Text Solution
|
- In Dianthus, placentation is :-
Text Solution
|
- Which one of the following figures represents the placentation on prim...
Text Solution
|
- Placentation in Dianthus is
Text Solution
|
- Which of the following diagram represents axile placentation?
Text Solution
|
- डाईएन्थस में बीजाण्डन्यास किस एक चित्र में दर्शाया गया है
Text Solution
|